29
/
en
AIzaSyAYiBZKx7MnpbEhh9jyipgxe19OcubqV5w
April 1, 2024
168237
Kenya
KEN
true
2
1
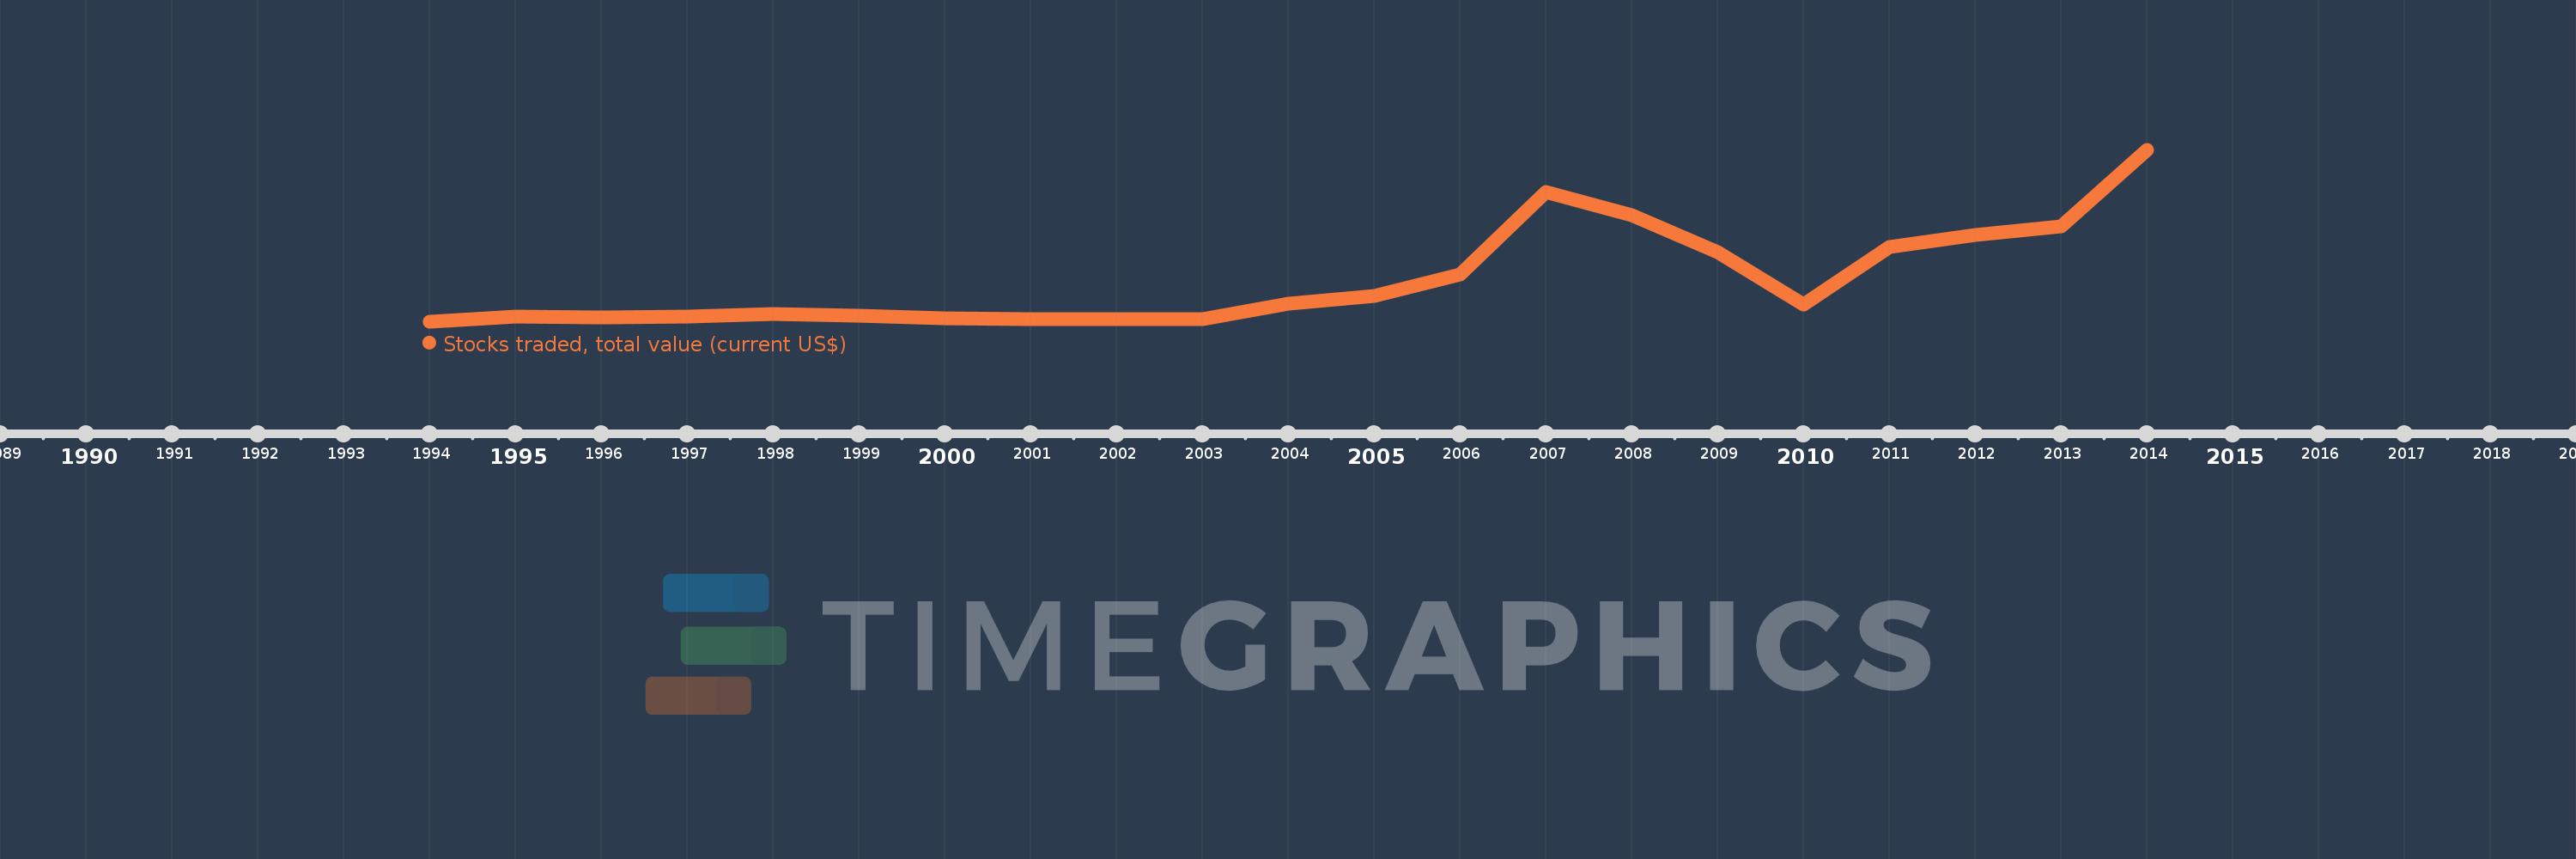
Stocks traded, total value (current US$)
2014,2013,2012,2011,2010,2009,2008,2007,2006,2005,2004,2003,2002,2001,2000,1999,1998,1997,1996,1995,1994
This statistics in other country:
Timeline:
This timeline shows a graph from 1994 to 2014 of Kenya. No data until 1993. Number of actual observations by date: 21.
Source name:
World Development Indicators
Source organization:
World Federation of Exchanges database.
Categories, topics:
Financial Sector
Last updated:
apr 23, 2017
Indicators value changes by year
Minimum:
12.1 mln
jan 1, 1994
Maximum:
1.805 bln
jan 1, 2014
At the date of observation
Value
Absolute change
Change from previous value
jan 1, 1994
12.1 mln
+12.1 mln
0.0%
jan 1, 1995
68.6 mln
+56.5 mln
466.94%
jan 1, 1996
59.85 mln
-8.75 mln
-12.76%
jan 1, 1997
71.18 mln
+11.33 mln
18.93%
jan 1, 1998
97.49 mln
+26.31 mln
36.96%
jan 1, 1999
74.2 mln
-23.29 mln
-23.89%
jan 1, 2000
48.5 mln
-25.7 mln
-34.64%
jan 1, 2001
37.8 mln
-10.7 mln
-22.06%
jan 1, 2002
39.3 mln
+1.5 mln
3.97%
jan 1, 2003
37.38 mln
-1.92 mln
-4.89%
jan 1, 2004
200.0 mln
+162.62 mln
435.05%
jan 1, 2005
283.84 mln
+83.84 mln
41.92%
jan 1, 2006
504.12 mln
+220.28 mln
77.61%
jan 1, 2007
1.364 bln
+860.15 mln
170.62%
jan 1, 2008
1.128 bln
-236.5 mln
-17.34%
jan 1, 2009
742.2 mln
-385.57 mln
-34.19%
jan 1, 2010
198.34 mln
-543.86 mln
-73.28%
jan 1, 2011
793.53 mln
+595.19 mln
300.09%
jan 1, 2012
917.25 mln
+123.72 mln
15.59%
jan 1, 2013
1.008 bln
+90.85 mln
9.9%
jan 1, 2014
1.805 bln
+796.6 mln
79.02%
Ranking of countries by current statistics by years


Comments: