29
/
en
AIzaSyAYiBZKx7MnpbEhh9jyipgxe19OcubqV5w
April 1, 2024
139790
Germany
DEU
true
2
1
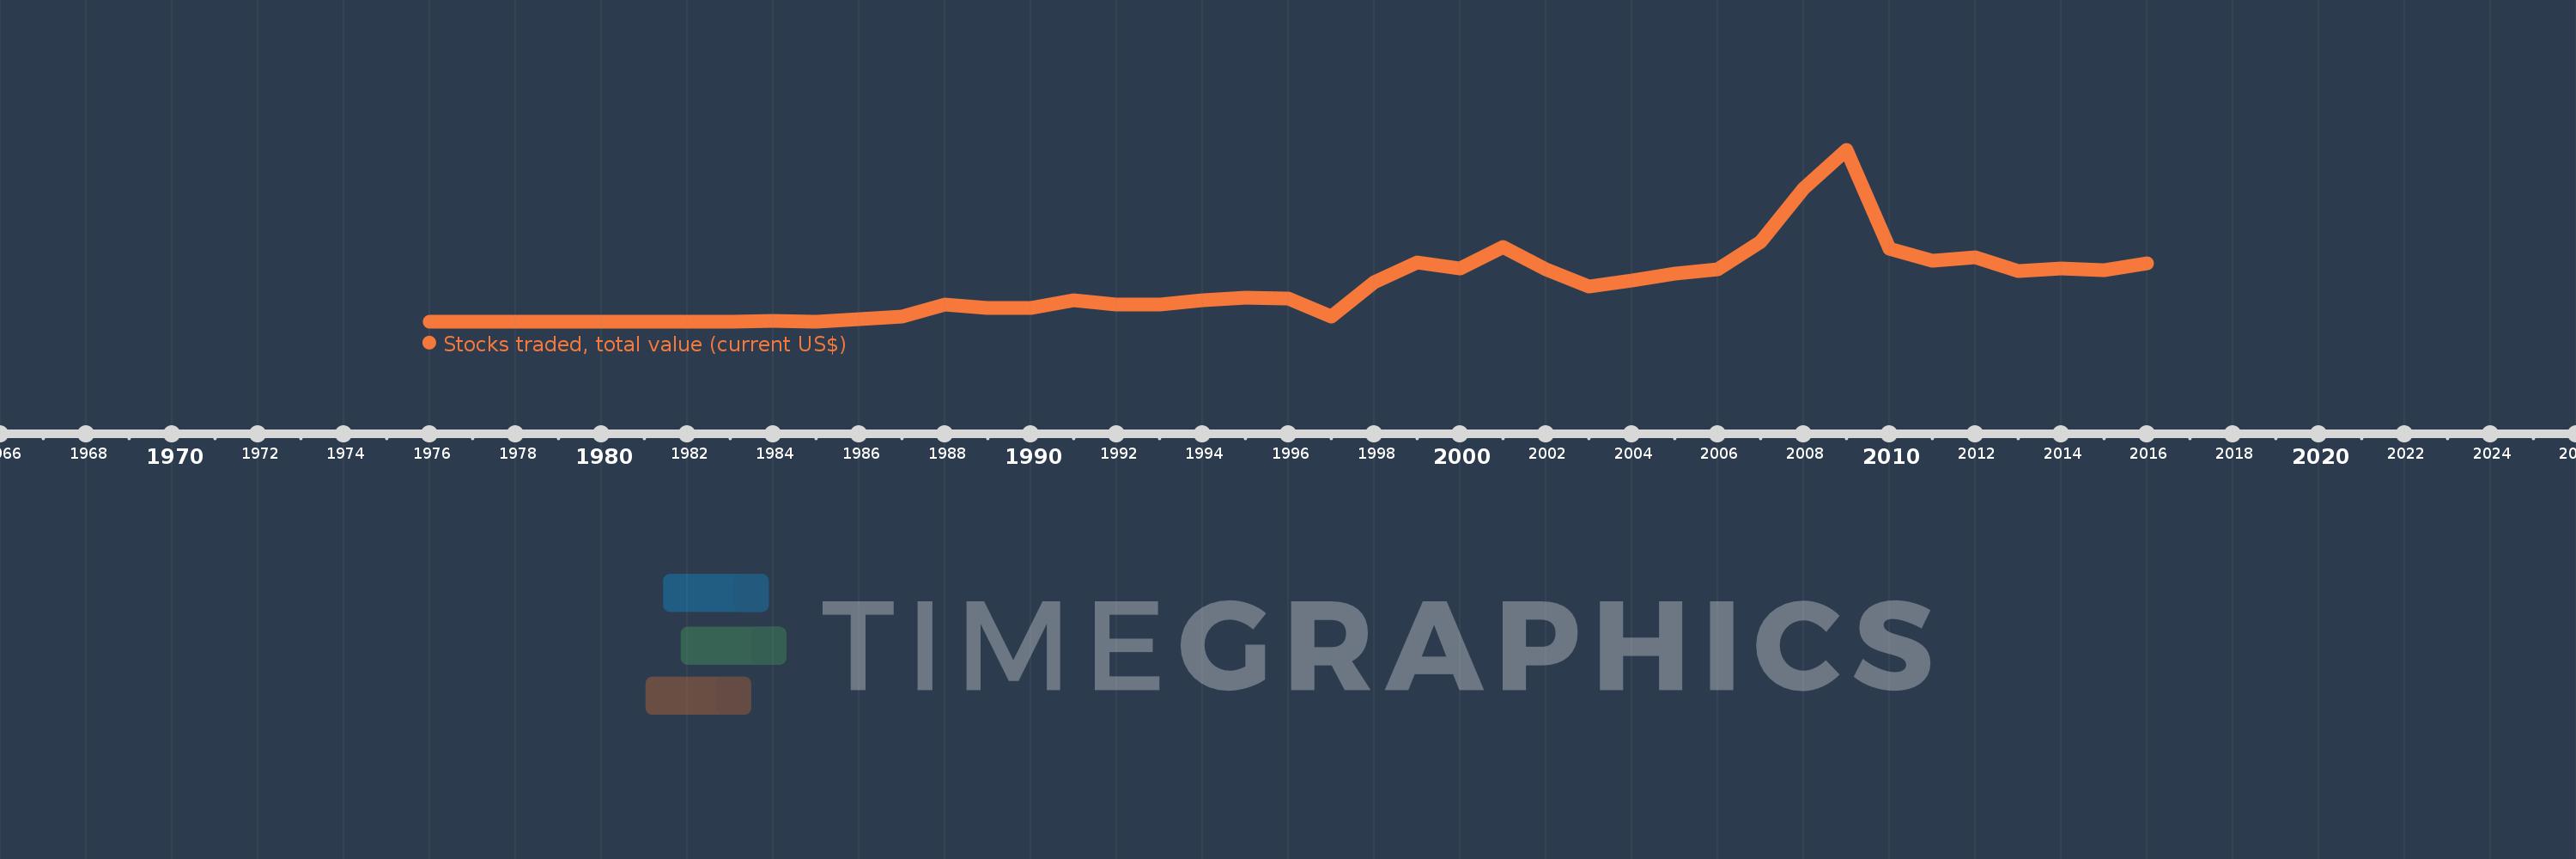
Stocks traded, total value (current US$)
2016,2015,2014,2013,2012,2011,2010,2009,2008,2007,2006,2005,2004,2003,2002,2001,2000,1999,1998,1997,1996,1995,1994,1993,1992,1991,1990,1989,1988,1987,1986,1985,1984,1983,1982,1981,1980,1979,1978,1977,1976
This statistics in other country:
Timeline:
This timeline shows a graph from 1976 to 2016 of Germany. No data until 1975. Number of actual observations by date: 41.
Source name:
World Development Indicators
Source organization:
World Federation of Exchanges database.
Categories, topics:
Financial Sector
Last updated:
apr 23, 2017
Indicators value changes by year
Minimum:
10.495 bln
jan 1, 1976
Maximum:
4.19 trl
jan 1, 2009
At the date of observation
Value
Absolute change
Change from previous value
jan 1, 1976
10.495 bln
+10.495 bln
0.0%
jan 1, 1977
10.565 bln
+69.9 mln
0.67%
jan 1, 1978
13.172 bln
+2.607 bln
24.68%
jan 1, 1979
18.804 bln
+5.632 bln
42.76%
jan 1, 1980
14.821 bln
-3.983 bln
-21.18%
jan 1, 1981
14.149 bln
-672.7 mln
-4.54%
jan 1, 1982
13.701 bln
-447.11 mln
-3.16%
jan 1, 1983
14.795 bln
+1.094 bln
7.98%
jan 1, 1984
30.886 bln
+16.091 bln
108.76%
jan 1, 1985
26.908 bln
-3.979 bln
-12.88%
jan 1, 1986
85.608 bln
+58.701 bln
218.16%
jan 1, 1987
151.831 bln
+66.222 bln
77.35%
jan 1, 1988
424.407 bln
+272.577 bln
179.53%
jan 1, 1989
345.321 bln
-79.086 bln
-18.63%
jan 1, 1990
348.053 bln
+2.732 bln
0.79%
jan 1, 1991
542.482 bln
+194.428 bln
55.86%
jan 1, 1992
437.577 bln
-104.904 bln
-19.34%
jan 1, 1993
430.084 bln
-7.493 bln
-1.71%
jan 1, 1994
529.577 bln
+99.493 bln
23.13%
jan 1, 1995
603.703 bln
+74.126 bln
14.0%
jan 1, 1996
580.135 bln
-23.569 bln
-3.9%
jan 1, 1997
149.81 bln
-430.325 bln
-74.18%
jan 1, 1998
988.221 bln
+838.412 bln
559.65%
jan 1, 1999
1.469 trl
+480.511 bln
48.62%
jan 1, 2000
1.308 trl
-160.238 bln
-10.91%
jan 1, 2001
1.827 trl
+518.743 bln
39.64%
jan 1, 2002
1.301 trl
-526.187 bln
-28.8%
jan 1, 2003
871.757 bln
-429.292 bln
-33.0%
jan 1, 2004
1.017 trl
+145.523 bln
16.69%
jan 1, 2005
1.181 trl
+164.019 bln
16.12%
jan 1, 2006
1.288 trl
+106.769 bln
9.04%
jan 1, 2007
1.951 trl
+662.77 bln
51.45%
jan 1, 2008
3.255 trl
+1.304 trl
66.84%
jan 1, 2009
4.19 trl
+934.803 bln
28.72%
jan 1, 2010
1.788 trl
-2.402 trl
-57.33%
jan 1, 2011
1.495 trl
-293.138 bln
-16.4%
jan 1, 2012
1.574 trl
+78.947 bln
5.28%
jan 1, 2013
1.25 trl
-323.659 bln
-20.57%
jan 1, 2014
1.313 trl
+62.666 bln
5.01%
jan 1, 2015
1.269 trl
-43.545 bln
-3.32%
jan 1, 2016
1.445 trl
+175.546 bln
13.83%
Ranking of countries by current statistics by years


Comments: