29
/
en
AIzaSyAYiBZKx7MnpbEhh9jyipgxe19OcubqV5w
April 1, 2024
51513
Middle income
MIC
false
2
1
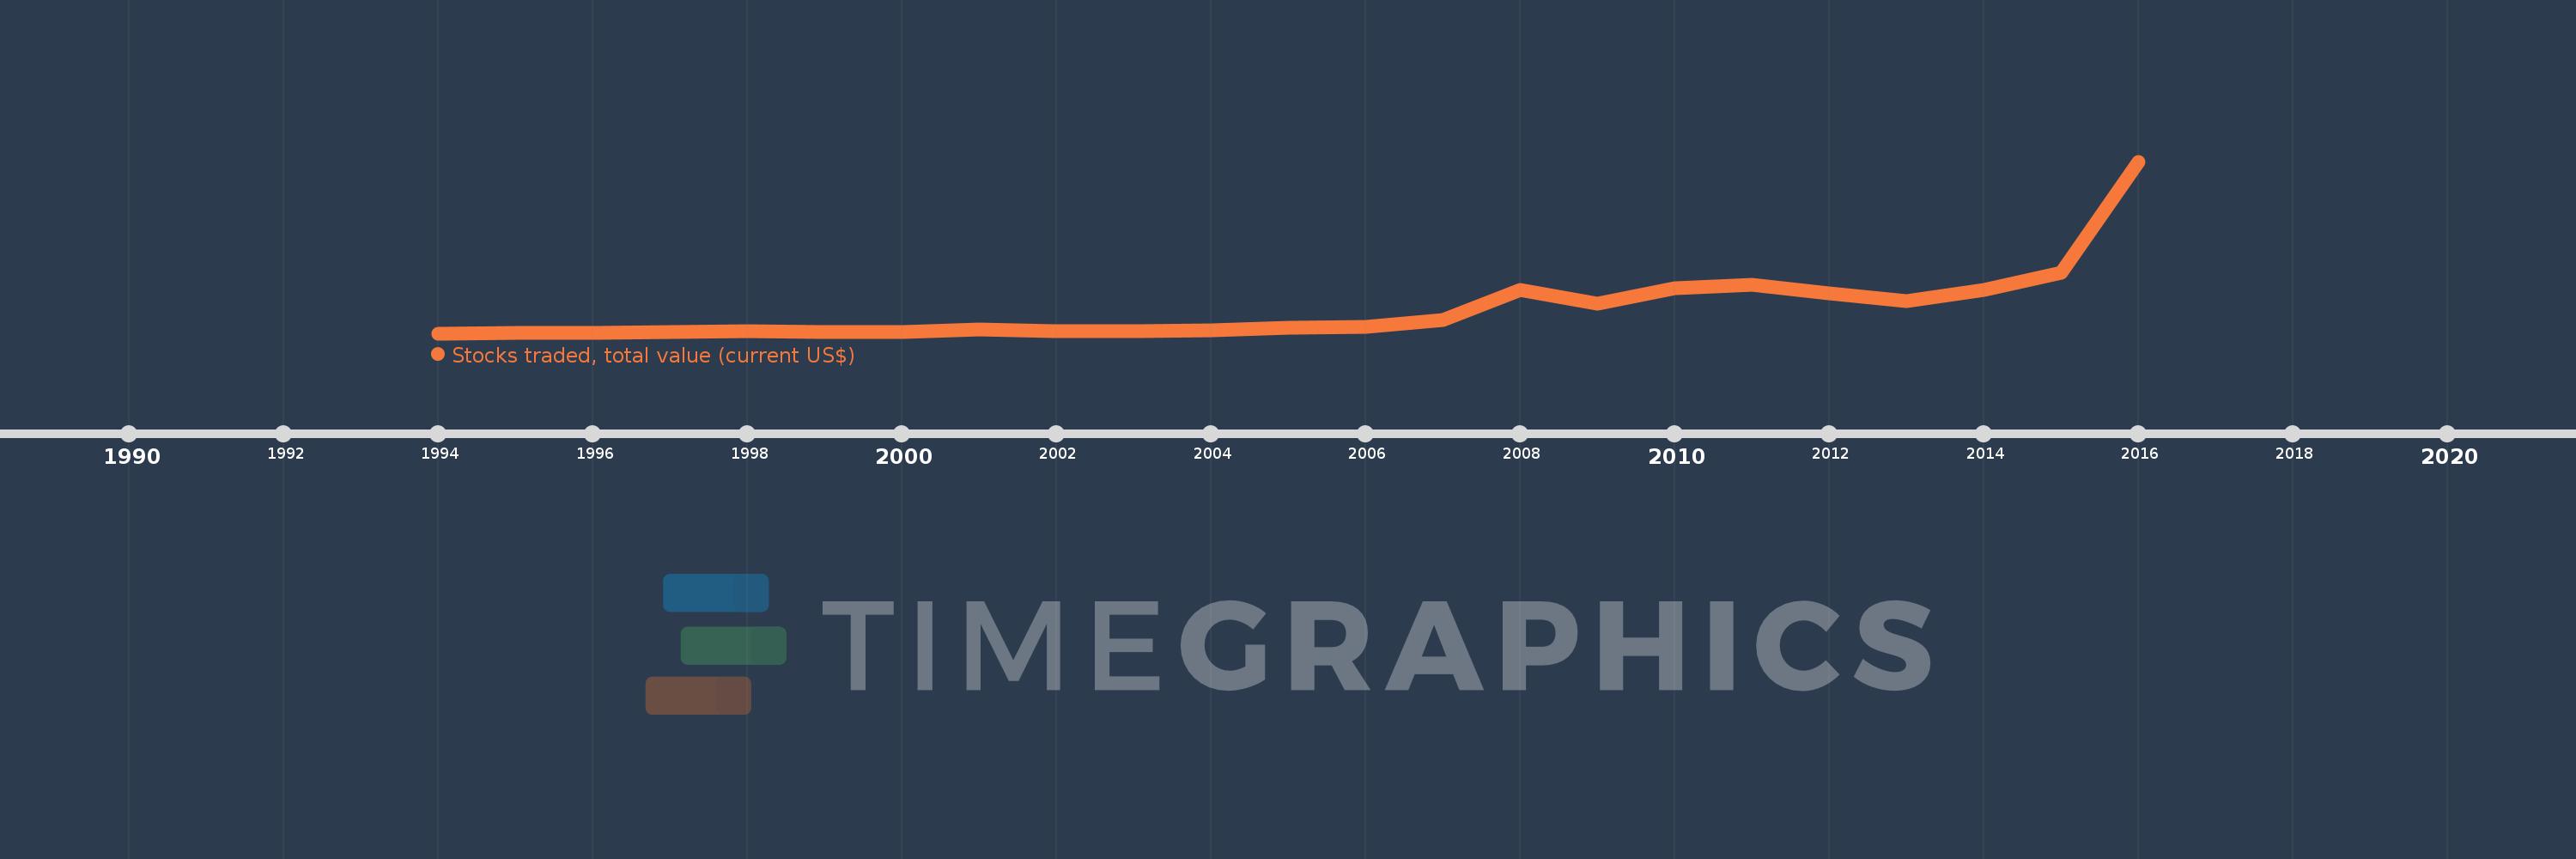
Stocks traded, total value (current US$)
2016,2015,2014,2013,2012,2011,2010,2009,2008,2007,2006,2005,2004,2003,2002,2001,2000,1999,1998,1997,1996,1995,1994
This statistics in other country:
Timeline:
This timeline shows a graph from 1994 to 2016 of Middle income. No data until 1993. Number of actual observations by date: 23.
Source name:
World Development Indicators
Source organization:
World Federation of Exchanges database.
Categories, topics:
Financial Sector
Last updated:
apr 23, 2017
Indicators value changes by year
Minimum:
335.28 bln
jan 1, 1994
Maximum:
41.893 trl
jan 1, 2016
At the date of observation
Value
Absolute change
Change from previous value
jan 1, 1994
335.28 bln
+335.28 bln
0.0%
jan 1, 1995
483.988 bln
+148.708 bln
44.35%
jan 1, 1996
448.052 bln
-35.936 bln
-7.43%
jan 1, 1997
671.182 bln
+223.13 bln
49.8%
jan 1, 1998
902.691 bln
+231.509 bln
34.49%
jan 1, 1999
728.929 bln
-173.763 bln
-19.25%
jan 1, 2000
709.969 bln
-18.96 bln
-2.6%
jan 1, 2001
1.298 trl
+587.801 bln
82.79%
jan 1, 2002
953.659 bln
-344.111 bln
-26.52%
jan 1, 2003
785.118 bln
-168.541 bln
-17.67%
jan 1, 2004
1.163 trl
+377.538 bln
48.09%
jan 1, 2005
1.783 trl
+620.321 bln
53.35%
jan 1, 2006
1.913 trl
+130.358 bln
7.31%
jan 1, 2007
3.619 trl
+1.705 trl
89.12%
jan 1, 2008
10.744 trl
+7.126 trl
196.93%
jan 1, 2009
7.599 trl
-3.146 trl
-29.28%
jan 1, 2010
11.25 trl
+3.651 trl
48.05%
jan 1, 2011
12.165 trl
+915.09 bln
8.13%
jan 1, 2012
9.974 trl
-2.191 trl
-18.01%
jan 1, 2013
8.117 trl
-1.857 trl
-18.62%
jan 1, 2014
10.731 trl
+2.614 trl
32.21%
jan 1, 2015
14.94 trl
+4.209 trl
39.22%
jan 1, 2016
41.893 trl
+26.953 trl
180.41%
Ranking of countries by current statistics by years


Comments: