29
/
en
AIzaSyAYiBZKx7MnpbEhh9jyipgxe19OcubqV5w
April 1, 2024
115389
Croatia
HRV
true
2
1
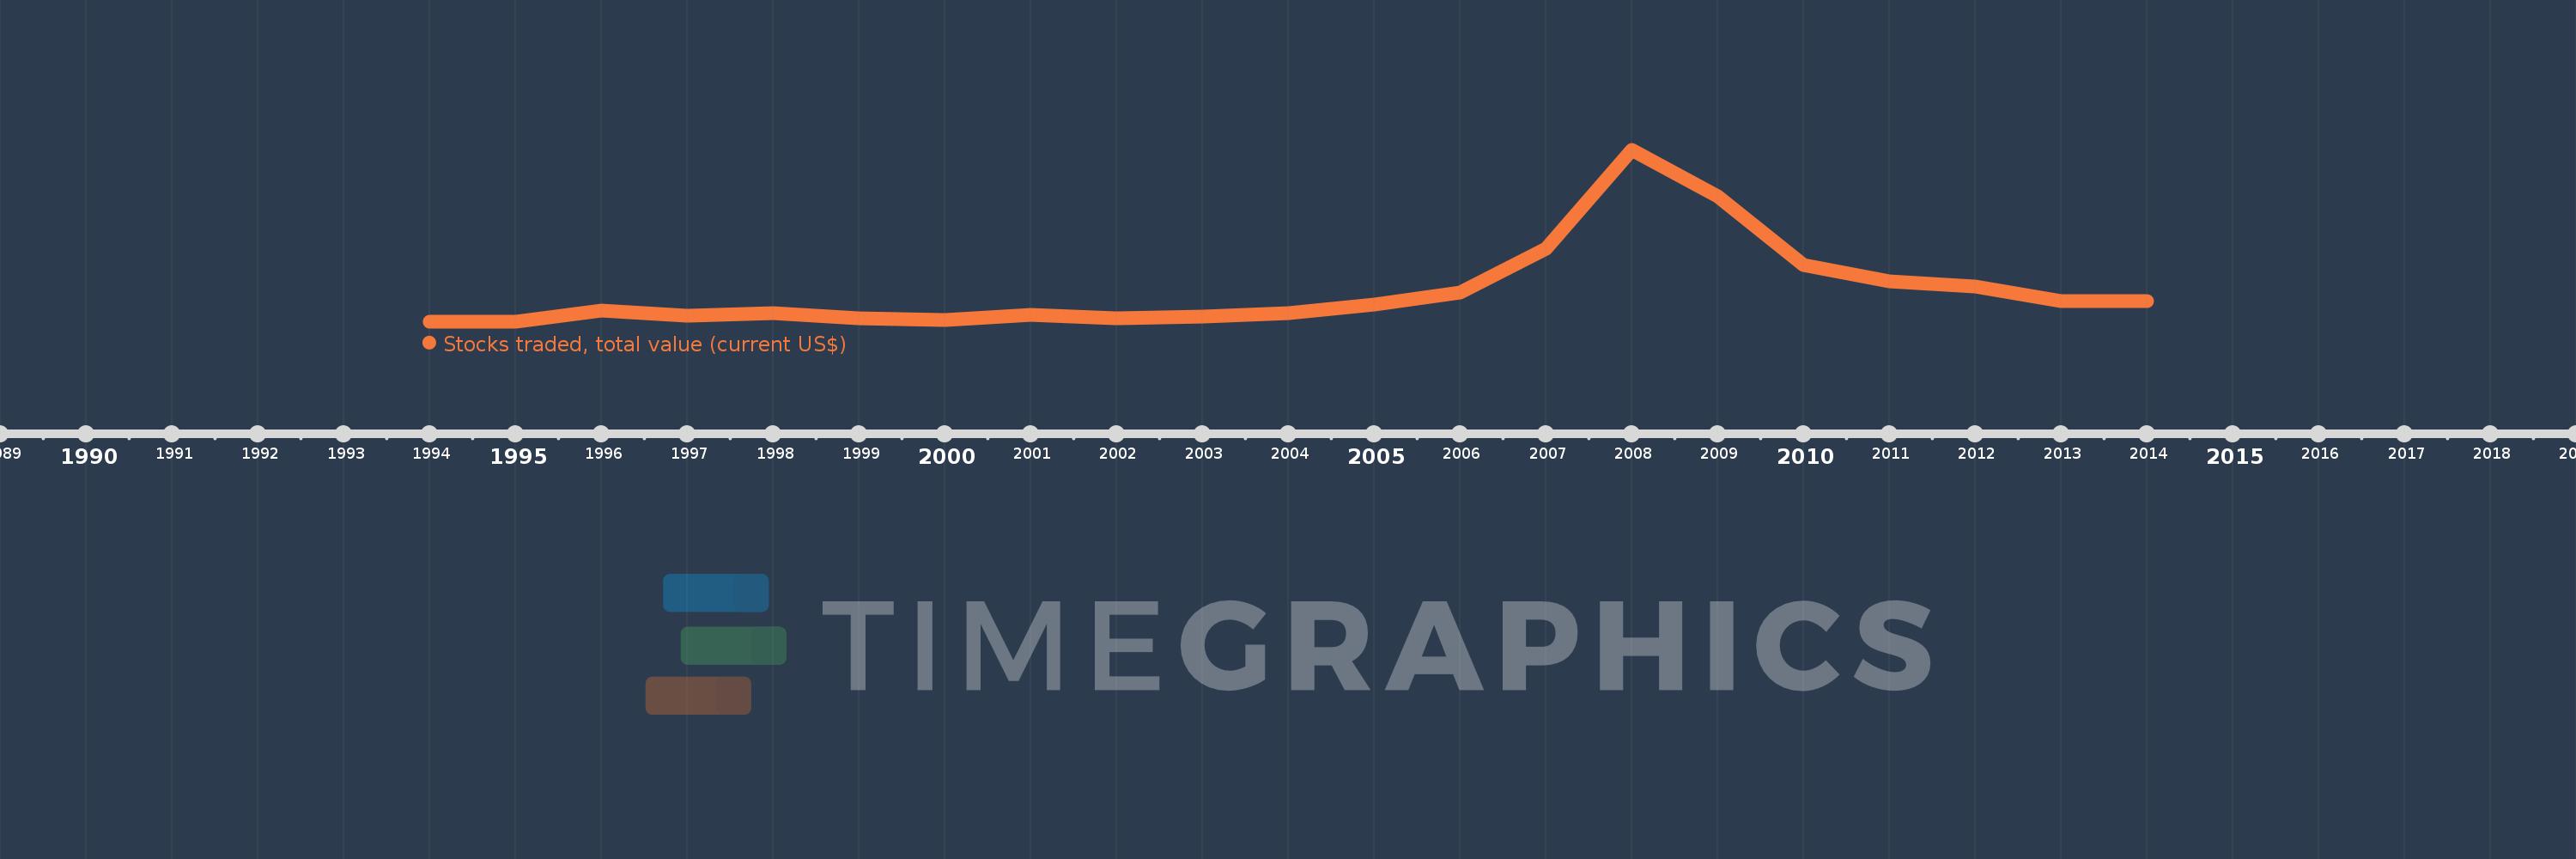
Stocks traded, total value (current US$)
2014,2013,2012,2011,2010,2009,2008,2007,2006,2005,2004,2003,2002,2001,2000,1999,1998,1997,1996,1995,1994
This statistics in other country:
Timeline:
This timeline shows a graph from 1994 to 2014 of Croatia. No data until 1993. Number of actual observations by date: 21.
Source name:
World Development Indicators
Source organization:
World Federation of Exchanges database.
Categories, topics:
Financial Sector
Last updated:
apr 23, 2017
Indicators value changes by year
Minimum:
13.2 mln
jan 1, 1994
Maximum:
4.386 bln
jan 1, 2008
At the date of observation
Value
Absolute change
Change from previous value
jan 1, 1994
13.2 mln
+13.2 mln
0.0%
jan 1, 1995
13.2 mln
0.0
0.0%
jan 1, 1996
308.0 mln
+294.8 mln
2.23K%
jan 1, 1997
178.72 mln
-129.28 mln
-41.97%
jan 1, 1998
242.36 mln
+63.64 mln
35.61%
jan 1, 1999
100.04 mln
-142.32 mln
-58.72%
jan 1, 2000
68.81 mln
-31.23 mln
-31.22%
jan 1, 2001
189.23 mln
+120.42 mln
175.0%
jan 1, 2002
115.9 mln
-73.33 mln
-38.75%
jan 1, 2003
160.17 mln
+44.27 mln
38.2%
jan 1, 2004
246.53 mln
+86.36 mln
53.92%
jan 1, 2005
464.98 mln
+218.45 mln
88.61%
jan 1, 2006
756.92 mln
+291.94 mln
62.79%
jan 1, 2007
1.876 bln
+1.119 bln
147.87%
jan 1, 2008
4.386 bln
+2.51 bln
133.78%
jan 1, 2009
3.216 bln
-1.17 bln
-26.68%
jan 1, 2010
1.462 bln
-1.754 bln
-54.54%
jan 1, 2011
1.05 bln
-412.04 mln
-28.19%
jan 1, 2012
926.79 mln
-123.06 mln
-11.72%
jan 1, 2013
542.7 mln
-384.09 mln
-41.44%
jan 1, 2014
553.8 mln
+11.1 mln
2.05%
Ranking of countries by current statistics by years


Comments: