29
/
en
AIzaSyAYiBZKx7MnpbEhh9jyipgxe19OcubqV5w
April 1, 2024
255843
Swaziland
SWZ
true
2
1
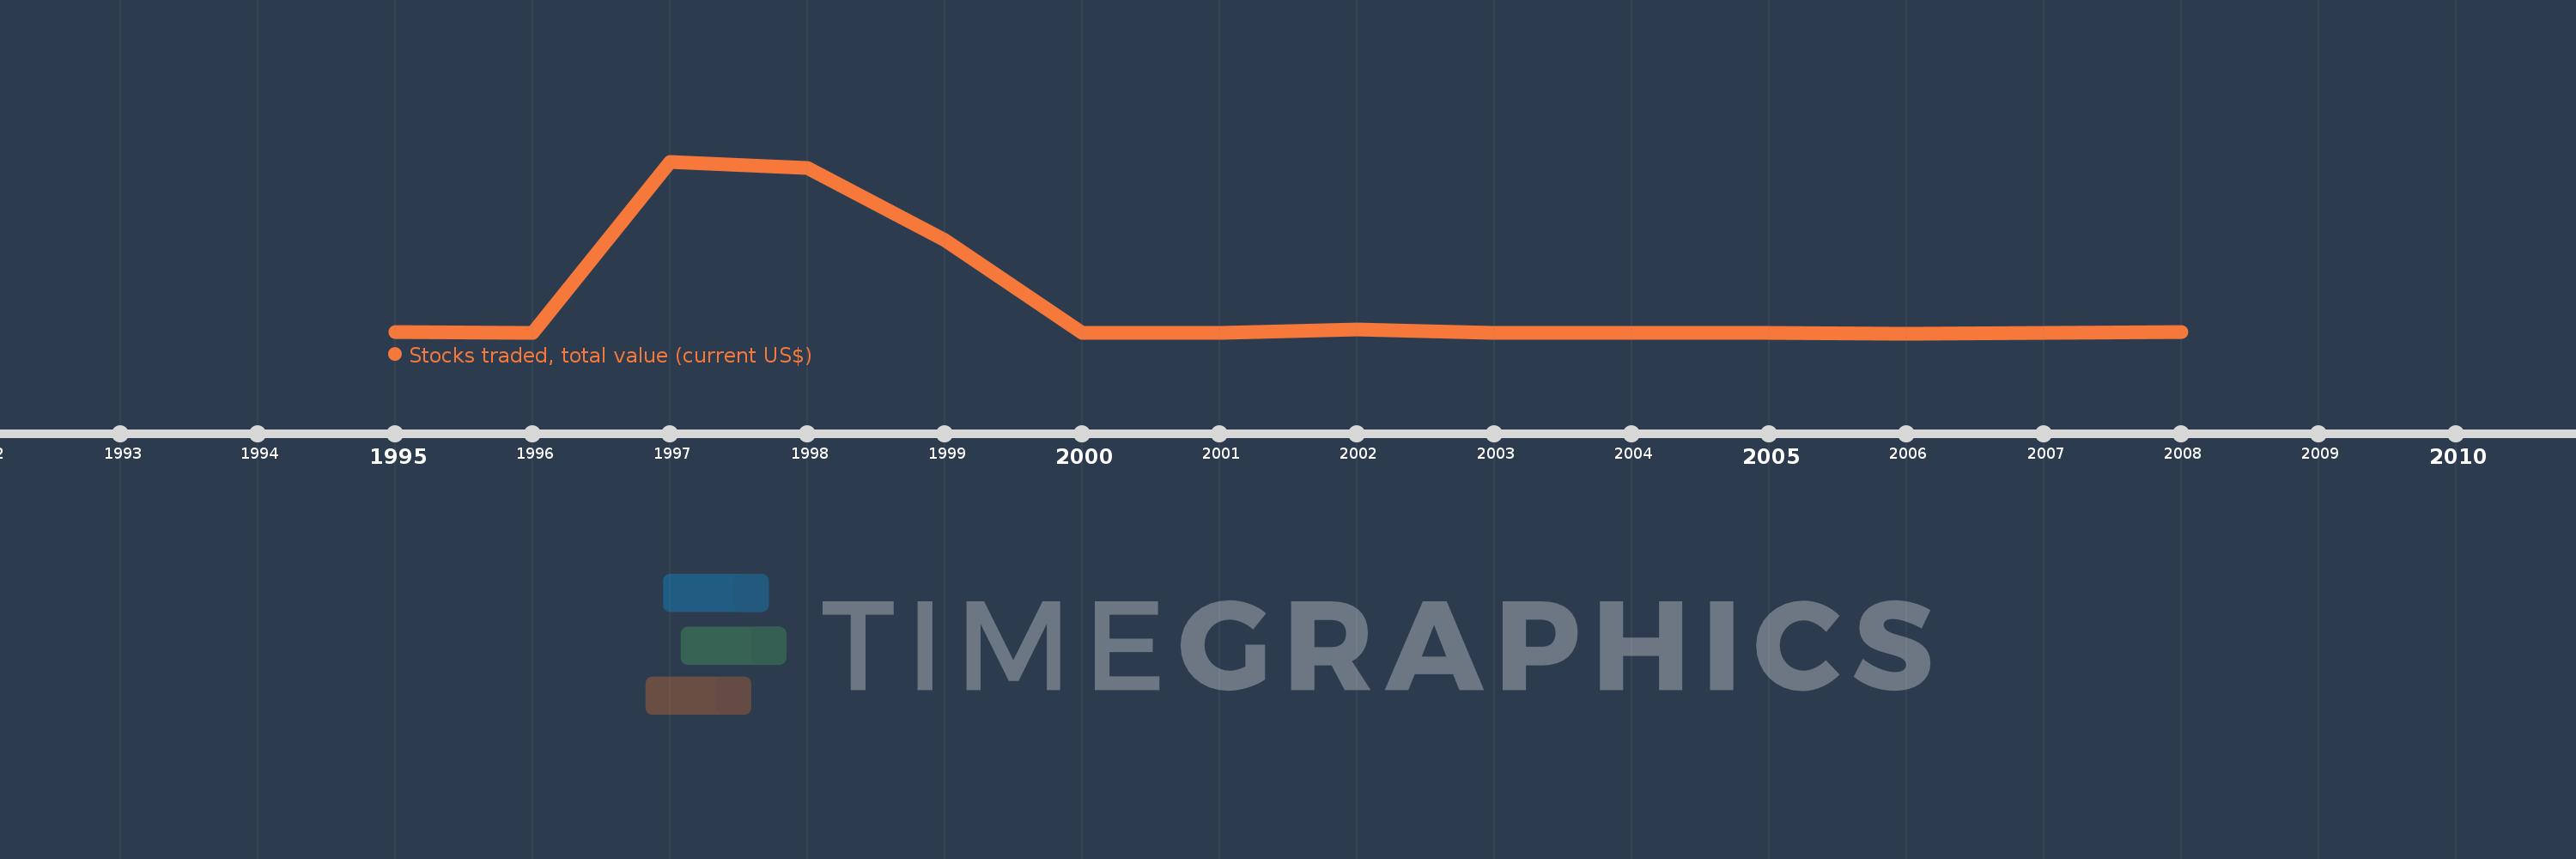
Stocks traded, total value (current US$)
2008,2007,2006,2005,2004,2003,2002,2001,2000,1999,1998,1997,1996,1995
This statistics in other country:
Timeline:
This timeline shows a graph from 1995 to 2008 of Swaziland. No data until 1994. Number of actual observations by date: 14.
Source name:
World Development Indicators
Source organization:
World Federation of Exchanges database.
Categories, topics:
Financial Sector
Last updated:
apr 23, 2017
Indicators value changes by year
Maximum:
371.76 mln
jan 1, 1997
At the date of observation
Value
Absolute change
Change from previous value
jan 1, 1995
2.1 mln
+2.1 mln
0.0%
jan 1, 1996
380.0K
-1.72 mln
-81.9%
jan 1, 1997
371.76 mln
+371.38 mln
97.73K%
jan 1, 1998
357.32 mln
-14.44 mln
-3.88%
jan 1, 1999
201.2 mln
-156.12 mln
-43.69%
jan 1, 2000
150.0K
-201.05 mln
-99.93%
jan 1, 2001
210.0K
+60.0K
40.0%
jan 1, 2002
8.5 mln
+8.29 mln
3.95K%
jan 1, 2003
180.0K
-8.32 mln
-97.88%
jan 1, 2004
50.0K
-130.0K
-72.22%
jan 1, 2005
40.0K
-10.0K
-20.0%
jan 1, 2006
30.0K
-10.0K
-25.0%
jan 1, 2007
60.0K
+30.0K
100.0%
jan 1, 2008
3.54 mln
+3.48 mln
5.8K%
Ranking of countries by current statistics by years


Comments: