29
/
en
AIzaSyAYiBZKx7MnpbEhh9jyipgxe19OcubqV5w
April 1, 2024
230456
Russian Federation
RUS
true
2
1
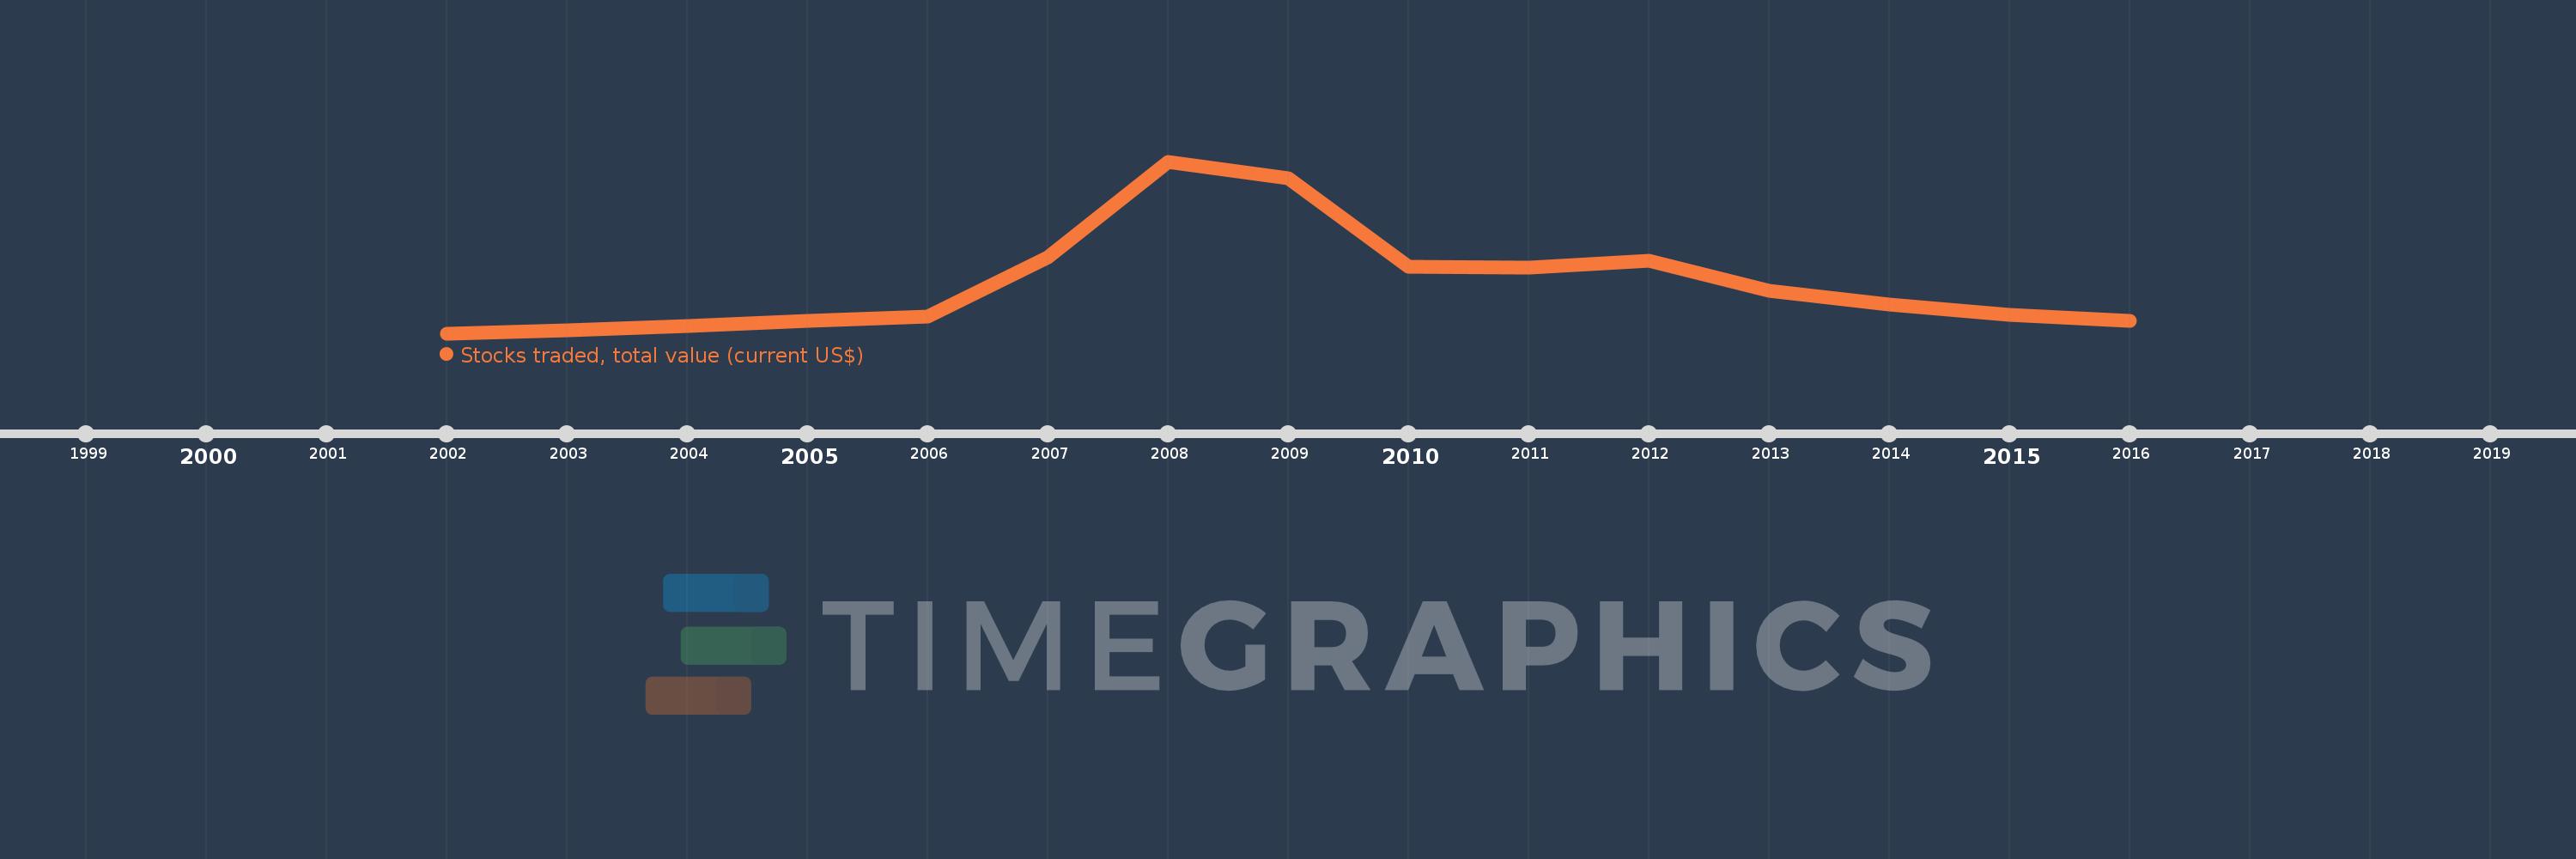
Stocks traded, total value (current US$)
2016,2015,2014,2013,2012,2011,2010,2009,2008,2007,2006,2005,2004,2003,2002
This statistics in other country:
Timeline:
This timeline shows a graph from 2002 to 2016 of Russian Federation. No data until 2001. Number of actual observations by date: 15.
Source name:
World Development Indicators
Source organization:
World Federation of Exchanges database.
Categories, topics:
Financial Sector
Last updated:
apr 23, 2017
Indicators value changes by year
Minimum:
28.202 bln
jan 1, 2002
Maximum:
1.277 trl
jan 1, 2008
At the date of observation
Value
Absolute change
Change from previous value
jan 1, 2002
28.202 bln
+28.202 bln
0.0%
jan 1, 2003
47.667 bln
+19.466 bln
69.02%
jan 1, 2004
79.723 bln
+32.056 bln
67.25%
jan 1, 2005
118.694 bln
+38.971 bln
48.88%
jan 1, 2006
147.886 bln
+29.192 bln
24.59%
jan 1, 2007
582.649 bln
+434.764 bln
293.99%
jan 1, 2008
1.277 trl
+694.372 bln
119.17%
jan 1, 2009
1.155 trl
-122.008 bln
-9.55%
jan 1, 2010
510.39 bln
-644.623 bln
-55.81%
jan 1, 2011
506.852 bln
-3.538 bln
-0.69%
jan 1, 2012
554.231 bln
+47.379 bln
9.35%
jan 1, 2013
340.316 bln
-213.916 bln
-38.6%
jan 1, 2014
235.51 bln
-104.806 bln
-30.8%
jan 1, 2015
159.94 bln
-75.57 bln
-32.09%
jan 1, 2016
117.317 bln
-42.623 bln
-26.65%
Ranking of countries by current statistics by years


Comments: