29
/
en
AIzaSyAYiBZKx7MnpbEhh9jyipgxe19OcubqV5w
April 1, 2024
77640
Bahrain
BHR
true
2
1
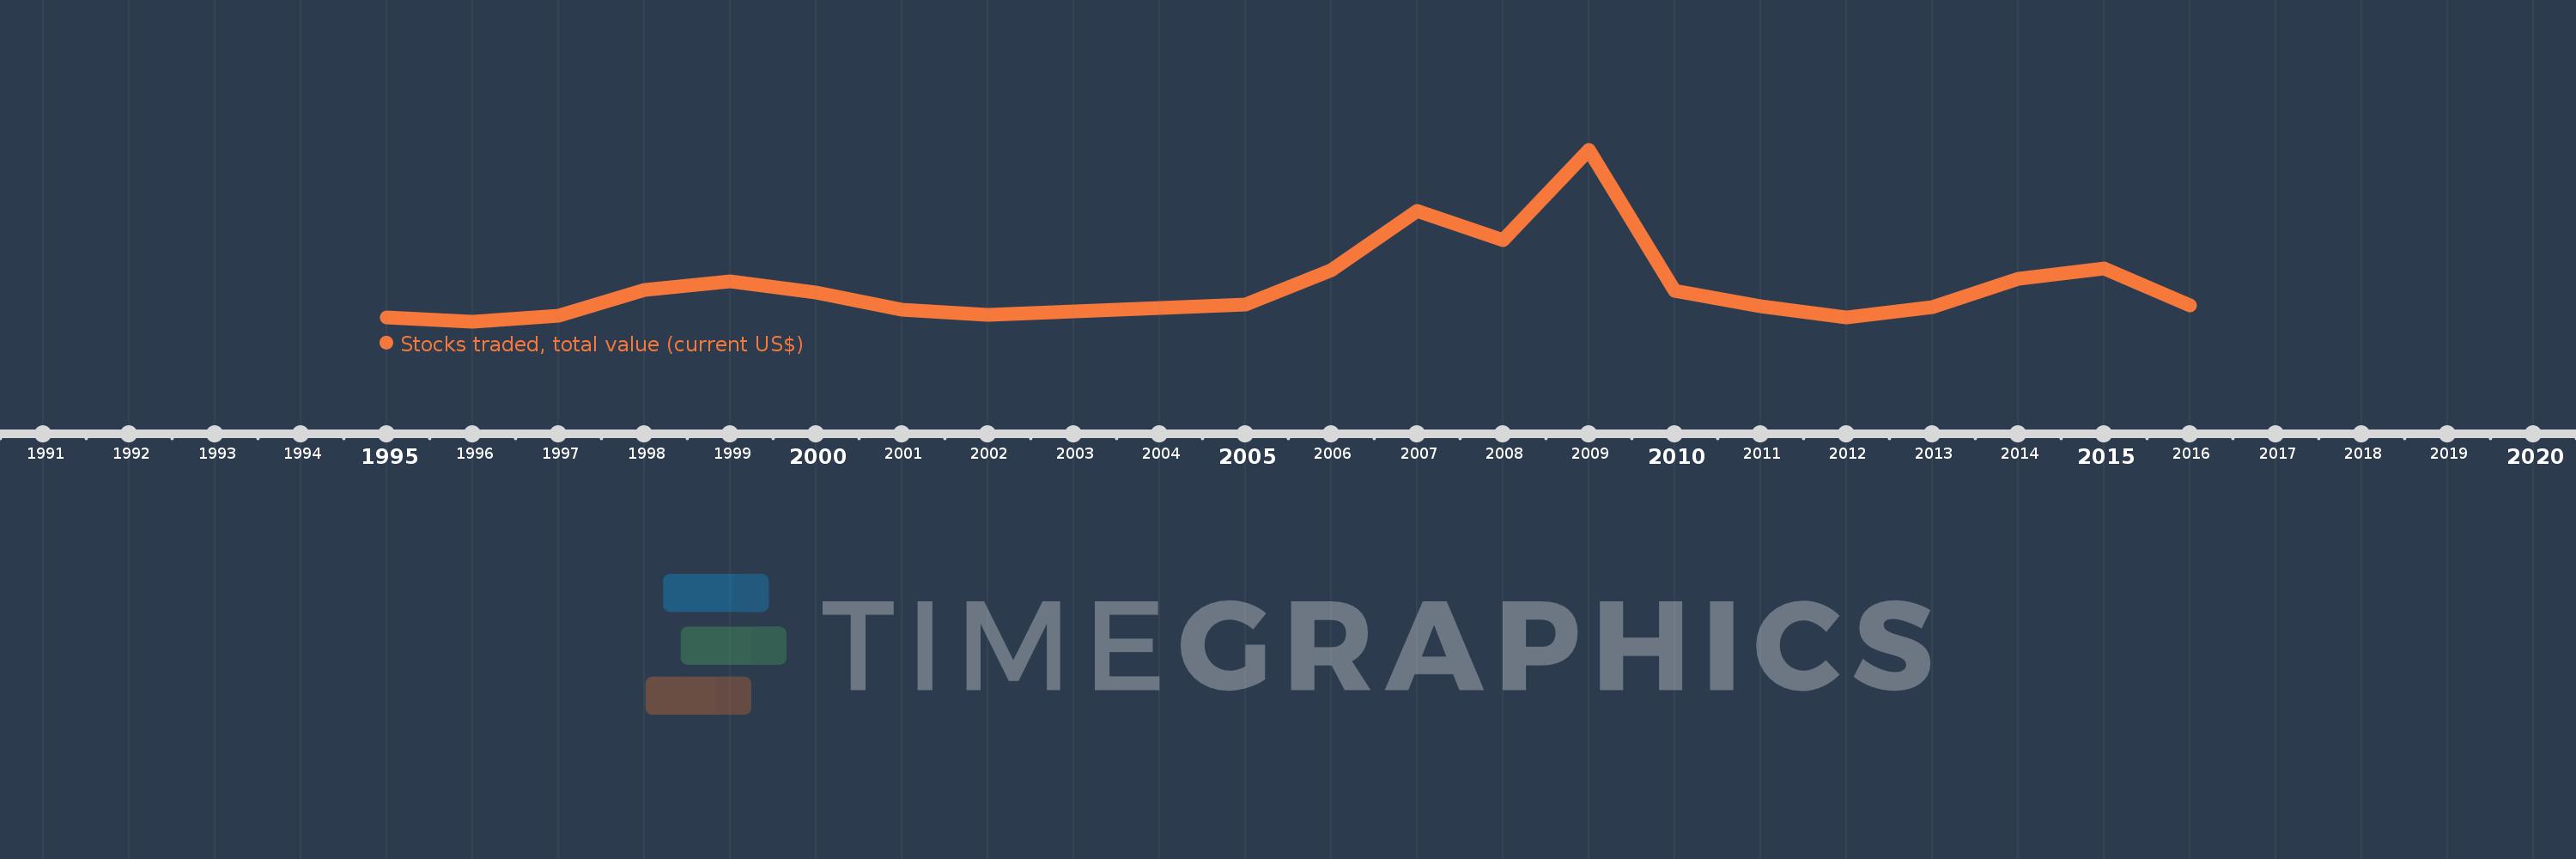
Stocks traded, total value (current US$)
2016,2015,2014,2013,2012,2011,2010,2009,2008,2007,2006,2005,2004,2002,2001,2000,1999,1998,1997,1996,1995
This statistics in other country:
Timeline:
This timeline shows a graph from 1995 to 2016 of Bahrain. No data until 1994. Number of actual observations by date: 21.
Source name:
World Development Indicators
Source organization:
World Federation of Exchanges database.
Categories, topics:
Financial Sector
Last updated:
apr 23, 2017
Indicators value changes by year
Minimum:
106.1 mln
jan 1, 1996
Maximum:
2.084 bln
jan 1, 2009
At the date of observation
Value
Absolute change
Change from previous value
jan 1, 1995
160.2 mln
+160.2 mln
0.0%
jan 1, 1996
106.1 mln
-54.1 mln
-33.77%
jan 1, 1997
176.7 mln
+70.6 mln
66.54%
jan 1, 1998
479.5 mln
+302.8 mln
171.36%
jan 1, 1999
576.39 mln
+96.89 mln
20.21%
jan 1, 2000
445.39 mln
-131.0 mln
-22.73%
jan 1, 2001
245.44 mln
-199.95 mln
-44.89%
jan 1, 2002
191.5 mln
-53.94 mln
-21.98%
jan 1, 2004
266.73 mln
+75.23 mln
39.28%
jan 1, 2005
311.64 mln
+44.91 mln
16.84%
jan 1, 2006
702.29 mln
+390.65 mln
125.35%
jan 1, 2007
1.381 bln
+678.83 mln
96.66%
jan 1, 2008
1.045 bln
-336.4 mln
-24.36%
jan 1, 2009
2.084 bln
+1.039 bln
99.44%
jan 1, 2010
466.28 mln
-1.617 bln
-77.62%
jan 1, 2011
287.56 mln
-178.72 mln
-38.33%
jan 1, 2012
156.13 mln
-131.43 mln
-45.71%
jan 1, 2013
278.4 mln
+122.27 mln
78.31%
jan 1, 2014
604.6 mln
+326.2 mln
117.17%
jan 1, 2015
717.8 mln
+113.2 mln
18.72%
jan 1, 2016
294.04 mln
-423.76 mln
-59.04%
Ranking of countries by current statistics by years


Comments: