29
/
en
AIzaSyAYiBZKx7MnpbEhh9jyipgxe19OcubqV5w
April 1, 2024
248074
Spain
ESP
true
2
1
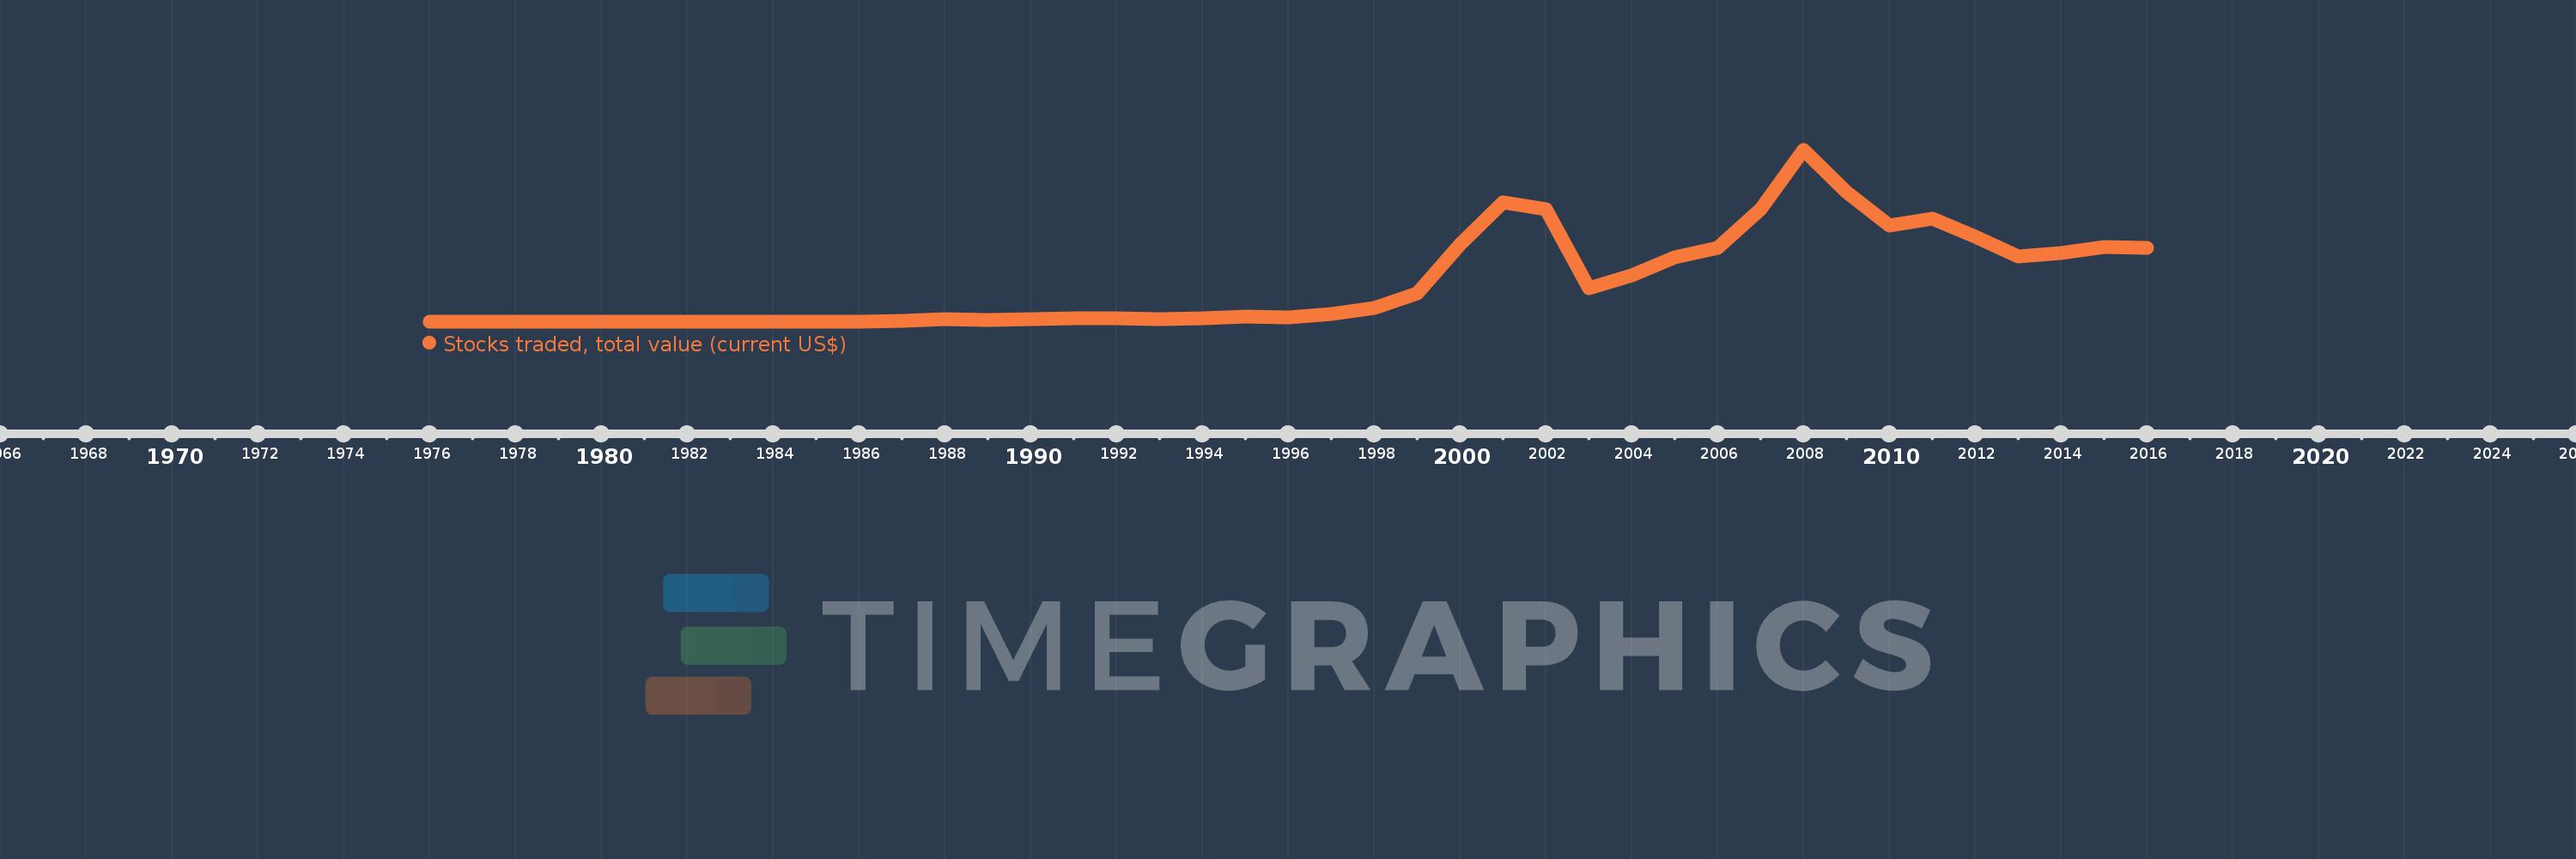
Stocks traded, total value (current US$)
2016,2015,2014,2013,2012,2011,2010,2009,2008,2007,2006,2005,2004,2003,2002,2001,2000,1999,1998,1997,1996,1995,1994,1993,1992,1991,1990,1989,1988,1987,1986,1985,1984,1983,1982,1981,1980,1979,1978,1977,1976
This statistics in other country:
Timeline:
This timeline shows a graph from 1976 to 2016 of Spain. No data until 1975. Number of actual observations by date: 41.
Source name:
World Development Indicators
Source organization:
World Federation of Exchanges database.
Categories, topics:
Financial Sector
Last updated:
apr 23, 2017
Indicators value changes by year
Minimum:
887.76 mln
jan 1, 1981
Maximum:
2.278 trl
jan 1, 2008
At the date of observation
Value
Absolute change
Change from previous value
jan 1, 1976
1.807 bln
+1.807 bln
0.0%
jan 1, 1977
1.962 bln
+155.0 mln
8.58%
jan 1, 1978
1.375 bln
-587.0 mln
-29.92%
jan 1, 1979
2.148 bln
+773.0 mln
56.22%
jan 1, 1980
1.119 bln
-1.029 bln
-47.89%
jan 1, 1981
887.76 mln
-231.46 mln
-20.68%
jan 1, 1982
1.536 bln
+648.51 mln
73.05%
jan 1, 1983
1.207 bln
-329.36 mln
-21.44%
jan 1, 1984
1.19 bln
-17.41 mln
-1.44%
jan 1, 1985
2.286 bln
+1.096 bln
92.16%
jan 1, 1986
3.731 bln
+1.445 bln
63.23%
jan 1, 1987
15.808 bln
+12.077 bln
323.7%
jan 1, 1988
40.862 bln
+25.053 bln
158.48%
jan 1, 1989
26.274 bln
-14.588 bln
-35.7%
jan 1, 1990
39.544 bln
+13.27 bln
50.51%
jan 1, 1991
45.238 bln
+5.694 bln
14.4%
jan 1, 1992
48.194 bln
+2.957 bln
6.54%
jan 1, 1993
38.08 bln
-10.115 bln
-20.99%
jan 1, 1994
45.39 bln
+7.31 bln
19.2%
jan 1, 1995
69.287 bln
+23.898 bln
52.65%
jan 1, 1996
65.932 bln
-3.356 bln
-4.84%
jan 1, 1997
103.558 bln
+37.627 bln
57.07%
jan 1, 1998
190.14 bln
+86.582 bln
83.61%
jan 1, 1999
376.135 bln
+185.995 bln
97.82%
jan 1, 2000
1.026 trl
+649.717 bln
172.74%
jan 1, 2001
1.584 trl
+557.701 bln
54.36%
jan 1, 2002
1.49 trl
-93.142 bln
-5.88%
jan 1, 2003
453.548 bln
-1.037 trl
-69.57%
jan 1, 2004
618.32 bln
+164.772 bln
36.33%
jan 1, 2005
860.943 bln
+242.624 bln
39.24%
jan 1, 2006
981.438 bln
+120.495 bln
14.0%
jan 1, 2007
1.499 trl
+517.066 bln
52.68%
jan 1, 2008
2.278 trl
+779.892 bln
52.04%
jan 1, 2009
1.727 trl
-551.276 bln
-24.2%
jan 1, 2010
1.278 trl
-449.113 bln
-26.0%
jan 1, 2011
1.374 trl
+96.264 bln
7.53%
jan 1, 2012
1.128 trl
-246.679 bln
-17.95%
jan 1, 2013
864.383 bln
-263.209 bln
-23.34%
jan 1, 2014
914.963 bln
+50.58 bln
5.85%
jan 1, 2015
991.721 bln
+76.758 bln
8.39%
jan 1, 2016
978.396 bln
-13.325 bln
-1.34%
Ranking of countries by current statistics by years


Comments: