29
/
en
AIzaSyAYiBZKx7MnpbEhh9jyipgxe19OcubqV5w
April 1, 2024
105482
Chile
CHL
true
2
1
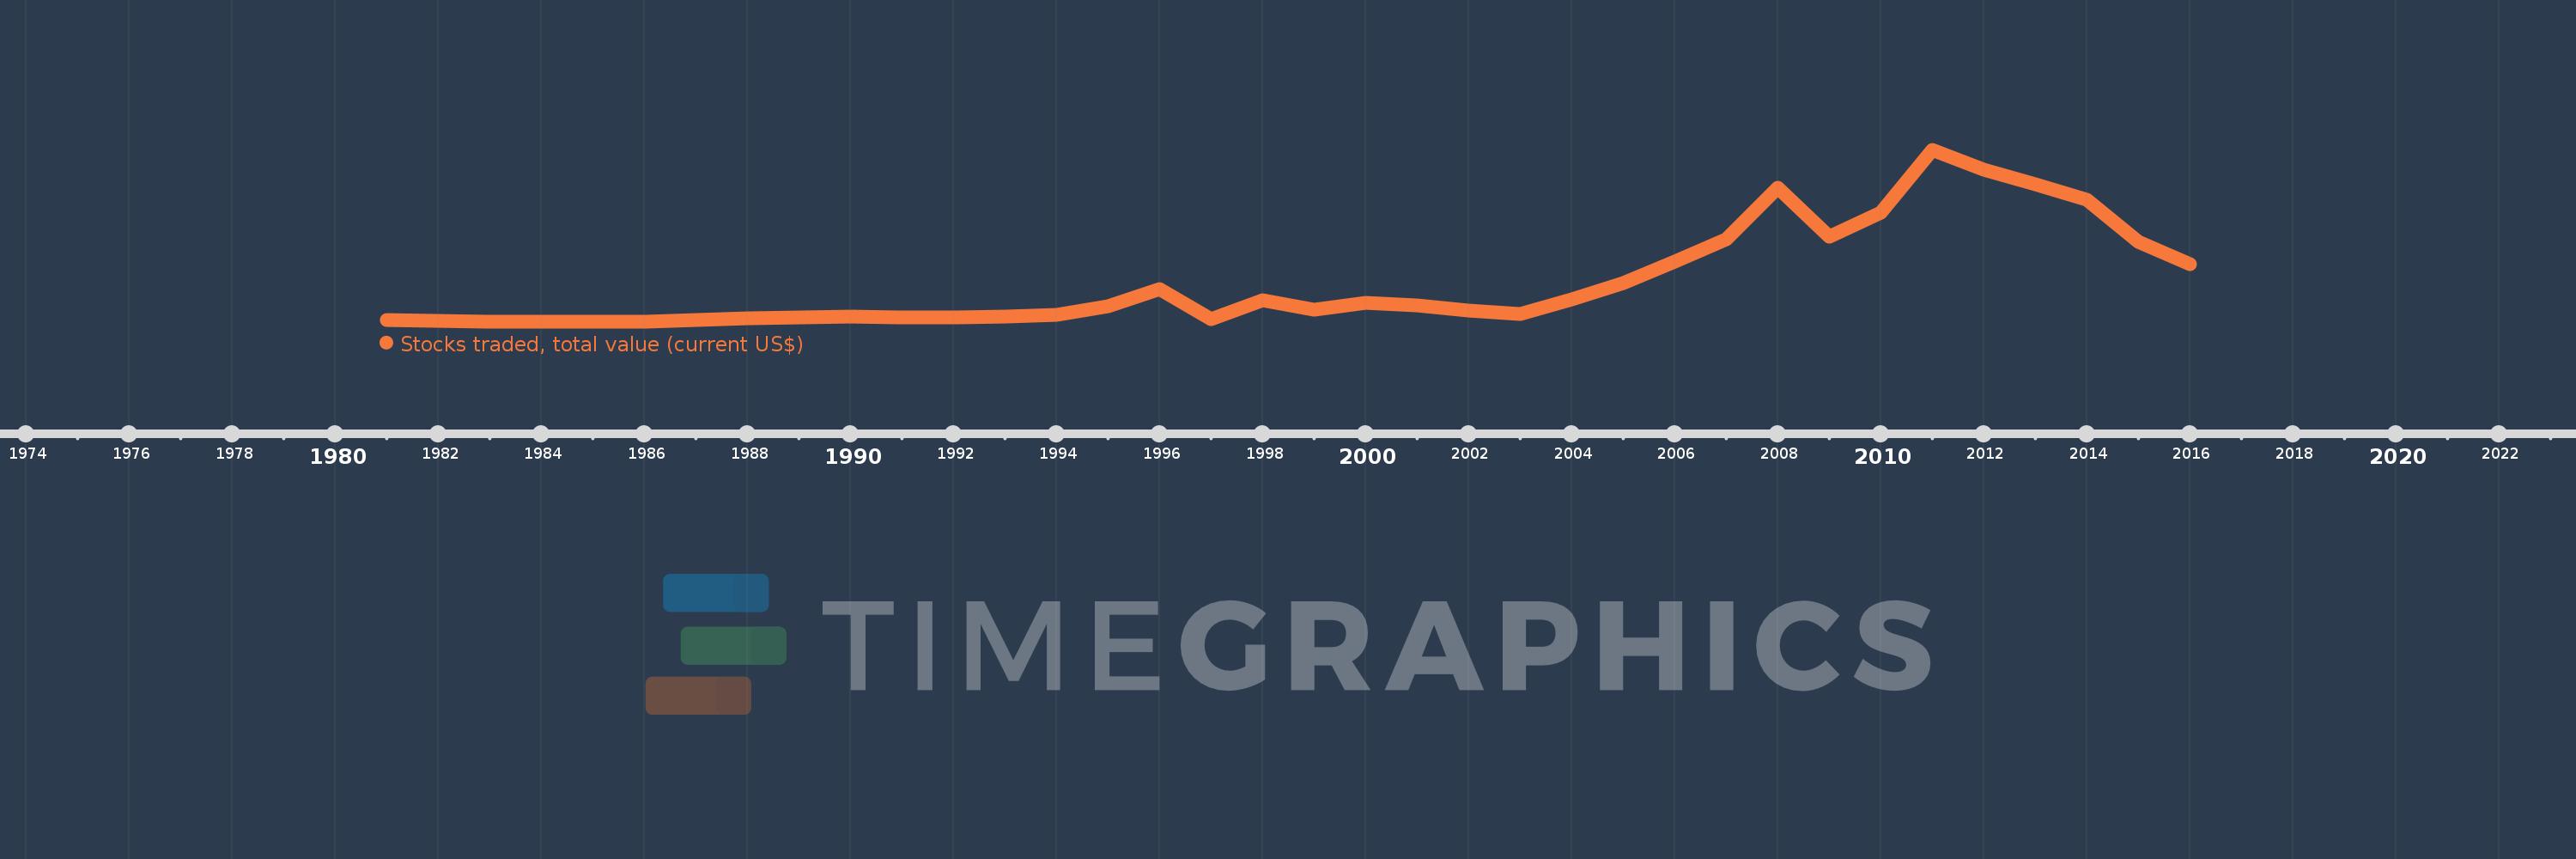
Stocks traded, total value (current US$)
2016,2015,2014,2013,2012,2011,2010,2009,2008,2007,2006,2005,2004,2003,2002,2001,2000,1999,1998,1997,1996,1995,1994,1993,1992,1991,1990,1989,1988,1987,1986,1985,1984,1983,1982,1981
This statistics in other country:
Timeline:
This timeline shows a graph from 1981 to 2016 of Chile. No data until 1980. Number of actual observations by date: 36.
Source name:
World Development Indicators
Source organization:
World Federation of Exchanges database.
Categories, topics:
Financial Sector
Last updated:
apr 23, 2017
Indicators value changes by year
Minimum:
100.0 mln
jan 1, 1985
Maximum:
57.925 bln
jan 1, 2011
At the date of observation
Value
Absolute change
Change from previous value
jan 1, 1981
753.0 mln
+753.0 mln
0.0%
jan 1, 1982
449.0 mln
-304.0 mln
-40.37%
jan 1, 1983
221.0 mln
-228.0 mln
-50.78%
jan 1, 1984
107.0 mln
-114.0 mln
-51.58%
jan 1, 1985
100.0 mln
-7.0 mln
-6.54%
jan 1, 1986
144.0 mln
+44.0 mln
44.0%
jan 1, 1987
755.0 mln
+611.0 mln
424.31%
jan 1, 1988
1.266 bln
+511.0 mln
67.68%
jan 1, 1989
1.525 bln
+259.0 mln
20.46%
jan 1, 1990
1.879 bln
+354.0 mln
23.21%
jan 1, 1991
1.577 bln
-302.0 mln
-16.07%
jan 1, 1992
1.769 bln
+191.84 mln
12.16%
jan 1, 1993
1.921 bln
+152.32 mln
8.61%
jan 1, 1994
2.641 bln
+720.15 mln
37.49%
jan 1, 1995
5.298 bln
+2.657 bln
100.59%
jan 1, 1996
11.086 bln
+5.788 bln
109.24%
jan 1, 1997
1.078 bln
-10.008 bln
-90.27%
jan 1, 1998
7.428 bln
+6.349 bln
588.74%
jan 1, 1999
4.299 bln
-3.129 bln
-42.12%
jan 1, 2000
6.522 bln
+2.223 bln
51.71%
jan 1, 2001
5.764 bln
-758.28 mln
-11.63%
jan 1, 2002
4.071 bln
-1.693 bln
-29.37%
jan 1, 2003
2.662 bln
-1.409 bln
-34.62%
jan 1, 2004
7.563 bln
+4.901 bln
184.12%
jan 1, 2005
13.082 bln
+5.519 bln
72.98%
jan 1, 2006
20.451 bln
+7.369 bln
56.33%
jan 1, 2007
27.812 bln
+7.362 bln
36.0%
jan 1, 2008
45.163 bln
+17.35 bln
62.38%
jan 1, 2009
28.872 bln
-16.29 bln
-36.07%
jan 1, 2010
37.034 bln
+8.162 bln
28.27%
jan 1, 2011
57.925 bln
+20.891 bln
56.41%
jan 1, 2012
51.267 bln
-6.659 bln
-11.5%
jan 1, 2013
46.492 bln
-4.775 bln
-9.31%
jan 1, 2014
41.227 bln
-5.265 bln
-11.32%
jan 1, 2015
27.131 bln
-14.096 bln
-34.19%
jan 1, 2016
19.675 bln
-7.456 bln
-27.48%
Ranking of countries by current statistics by years


Comments: