29
/
en
AIzaSyAYiBZKx7MnpbEhh9jyipgxe19OcubqV5w
April 1, 2024
163301
Jamaica
JAM
true
2
1
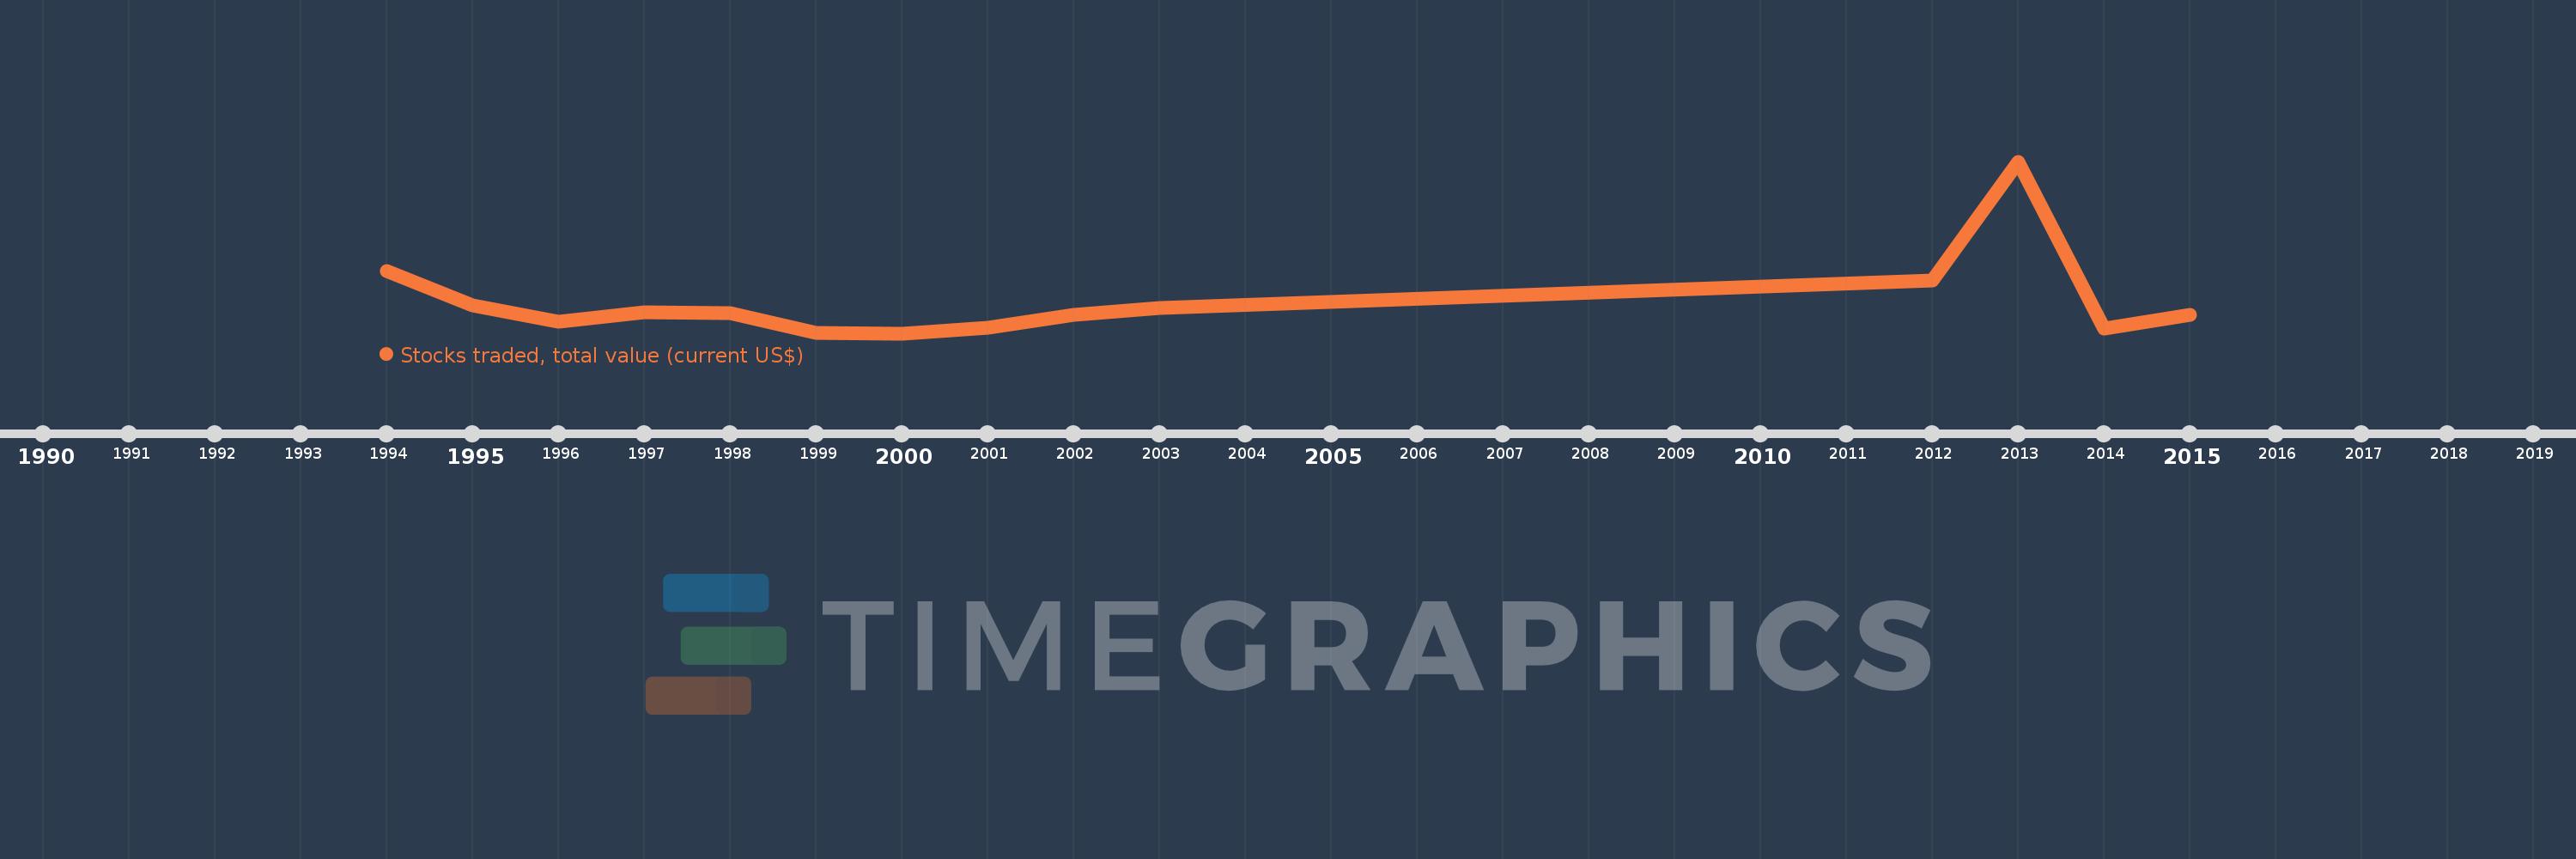
Stocks traded, total value (current US$)
2015,2014,2013,2012,2003,2002,2001,2000,1999,1998,1997,1996,1995,1994
This statistics in other country:
Timeline:
This timeline shows a graph from 1994 to 2015 of Jamaica. No data until 1993. Number of actual observations by date: 14.
Source name:
World Development Indicators
Source organization:
World Federation of Exchanges database.
Categories, topics:
Financial Sector
Last updated:
apr 23, 2017
Indicators value changes by year
Minimum:
53.85 mln
jan 1, 2000
Maximum:
716.4 mln
jan 1, 2013
At the date of observation
Value
Absolute change
Change from previous value
jan 1, 1994
293.3 mln
+293.3 mln
0.0%
jan 1, 1995
161.4 mln
-131.9 mln
-44.97%
jan 1, 1996
97.69 mln
-63.71 mln
-39.47%
jan 1, 1997
136.16 mln
+38.47 mln
39.38%
jan 1, 1998
132.21 mln
-3.95 mln
-2.9%
jan 1, 1999
55.71 mln
-76.5 mln
-57.86%
jan 1, 2000
53.85 mln
-1.86 mln
-3.34%
jan 1, 2001
76.3 mln
+22.45 mln
41.69%
jan 1, 2002
124.0 mln
+47.7 mln
62.52%
jan 1, 2003
153.2 mln
+29.2 mln
23.55%
jan 1, 2012
256.04 mln
+102.84 mln
67.13%
jan 1, 2013
716.4 mln
+460.36 mln
179.8%
jan 1, 2014
71.0 mln
-645.4 mln
-90.09%
jan 1, 2015
125.2 mln
+54.2 mln
76.34%
Ranking of countries by current statistics by years


Comments: