29
/
en
AIzaSyAYiBZKx7MnpbEhh9jyipgxe19OcubqV5w
April 1, 2024
199884
Mongolia
MNG
true
2
1
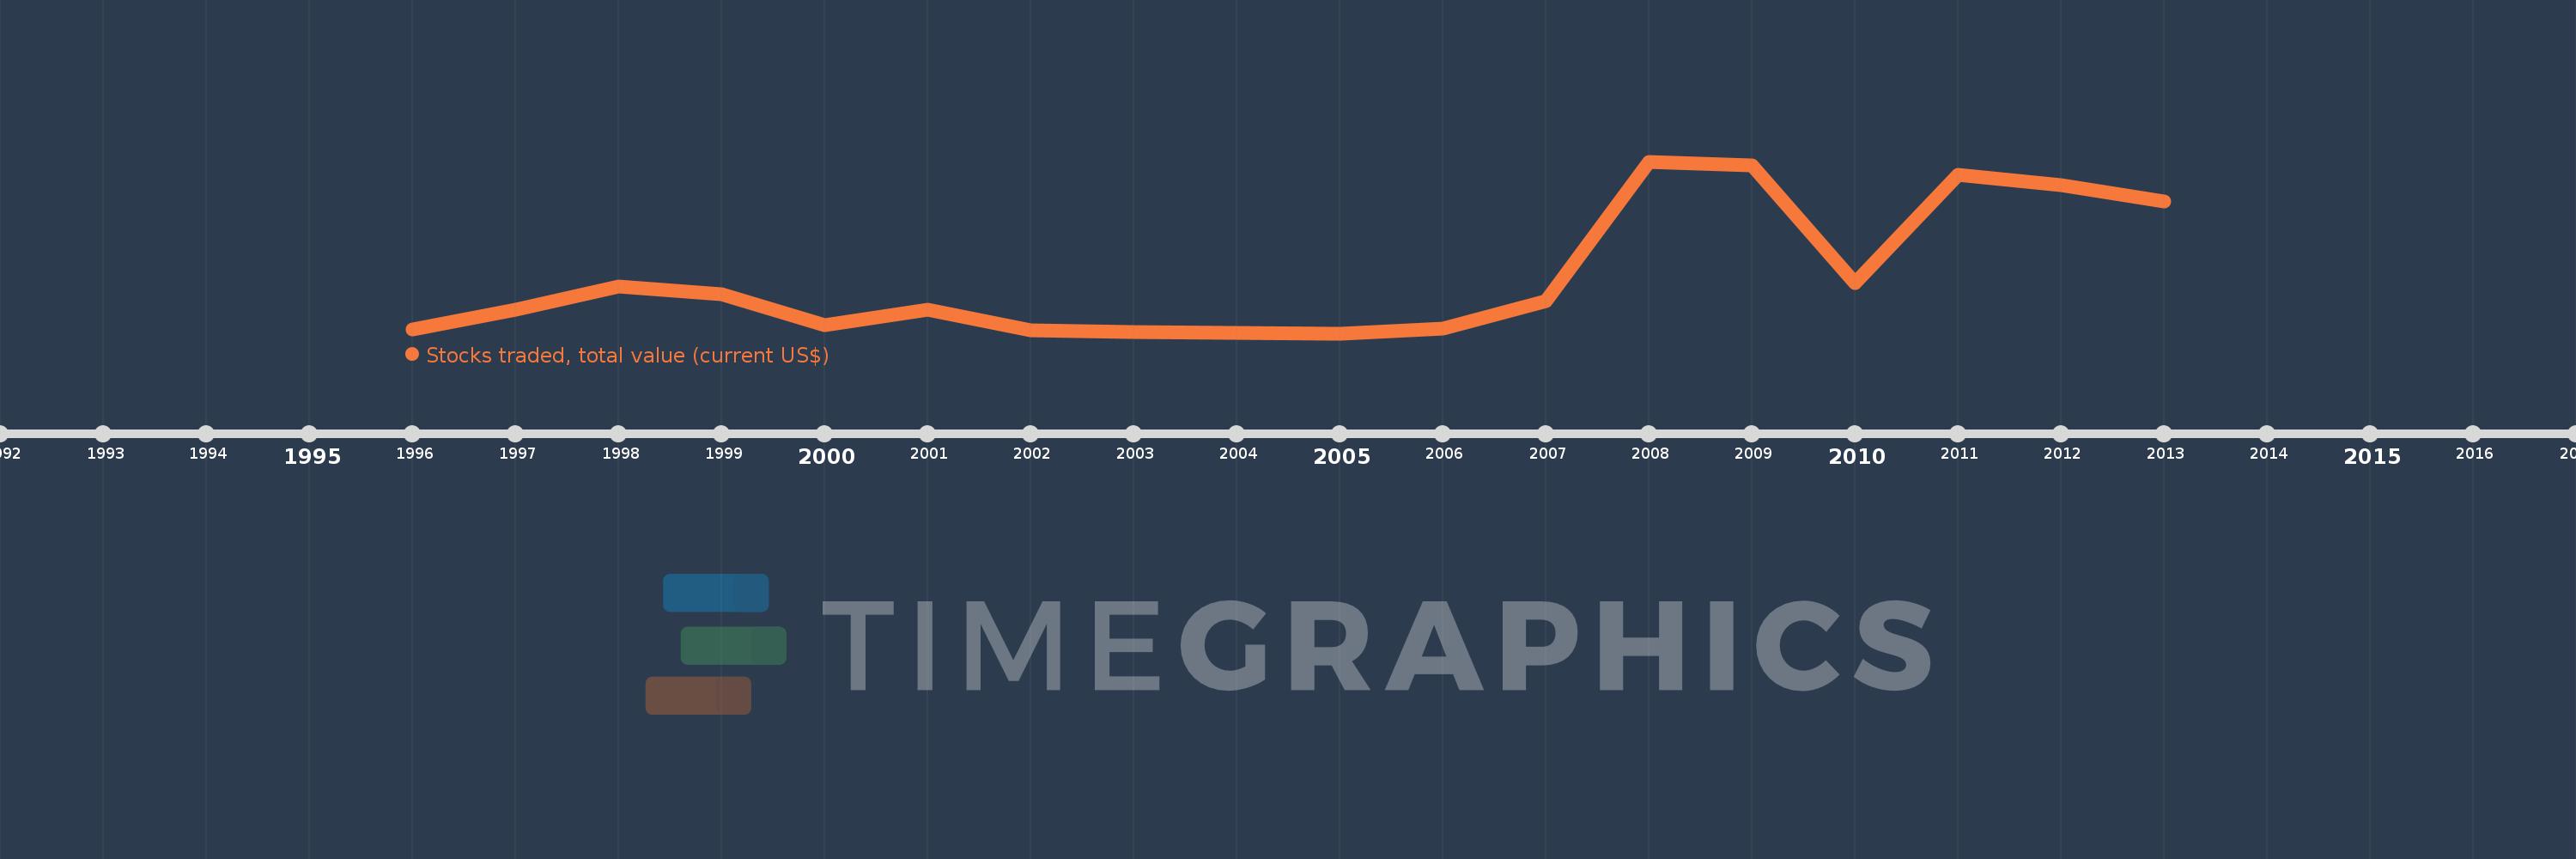
Stocks traded, total value (current US$)
2013,2012,2011,2010,2009,2008,2007,2006,2005,2004,2003,2002,2001,2000,1999,1998,1997,1996
This statistics in other country:
Timeline:
This timeline shows a graph from 1996 to 2013 of Mongolia. No data until 1995. Number of actual observations by date: 18.
Source name:
World Development Indicators
Source organization:
World Federation of Exchanges database.
Categories, topics:
Financial Sector
Last updated:
apr 23, 2017
Indicators value changes by year
Minimum:
780.0K
jan 1, 2005
Maximum:
53.118 mln
jan 1, 2008
At the date of observation
Value
Absolute change
Change from previous value
jan 1, 1996
2.0 mln
+2.0 mln
0.0%
jan 1, 1997
8.0 mln
+6.0 mln
300.0%
jan 1, 1998
15.0 mln
+7.0 mln
87.5%
jan 1, 1999
12.79 mln
-2.21 mln
-14.73%
jan 1, 2000
3.204 mln
-9.586 mln
-74.95%
jan 1, 2001
8.0 mln
+4.796 mln
149.69%
jan 1, 2002
1.6 mln
-6.4 mln
-80.0%
jan 1, 2003
1.2 mln
-400.0K
-25.0%
jan 1, 2004
800.0K
-400.0K
-33.33%
jan 1, 2005
780.0K
-20.0K
-2.5%
jan 1, 2006
2.162 mln
+1.382 mln
177.18%
jan 1, 2007
10.689 mln
+8.527 mln
394.4%
jan 1, 2008
53.118 mln
+42.429 mln
396.94%
jan 1, 2009
51.965 mln
-1.152 mln
-2.17%
jan 1, 2010
16.07 mln
-35.896 mln
-69.08%
jan 1, 2011
49.0 mln
+32.93 mln
204.92%
jan 1, 2012
45.806 mln
-3.194 mln
-6.52%
jan 1, 2013
40.892 mln
-4.914 mln
-10.73%
Ranking of countries by current statistics by years


Comments: