29
/
en
AIzaSyAYiBZKx7MnpbEhh9jyipgxe19OcubqV5w
April 1, 2024
87986
Bolivia
BOL
true
2
1
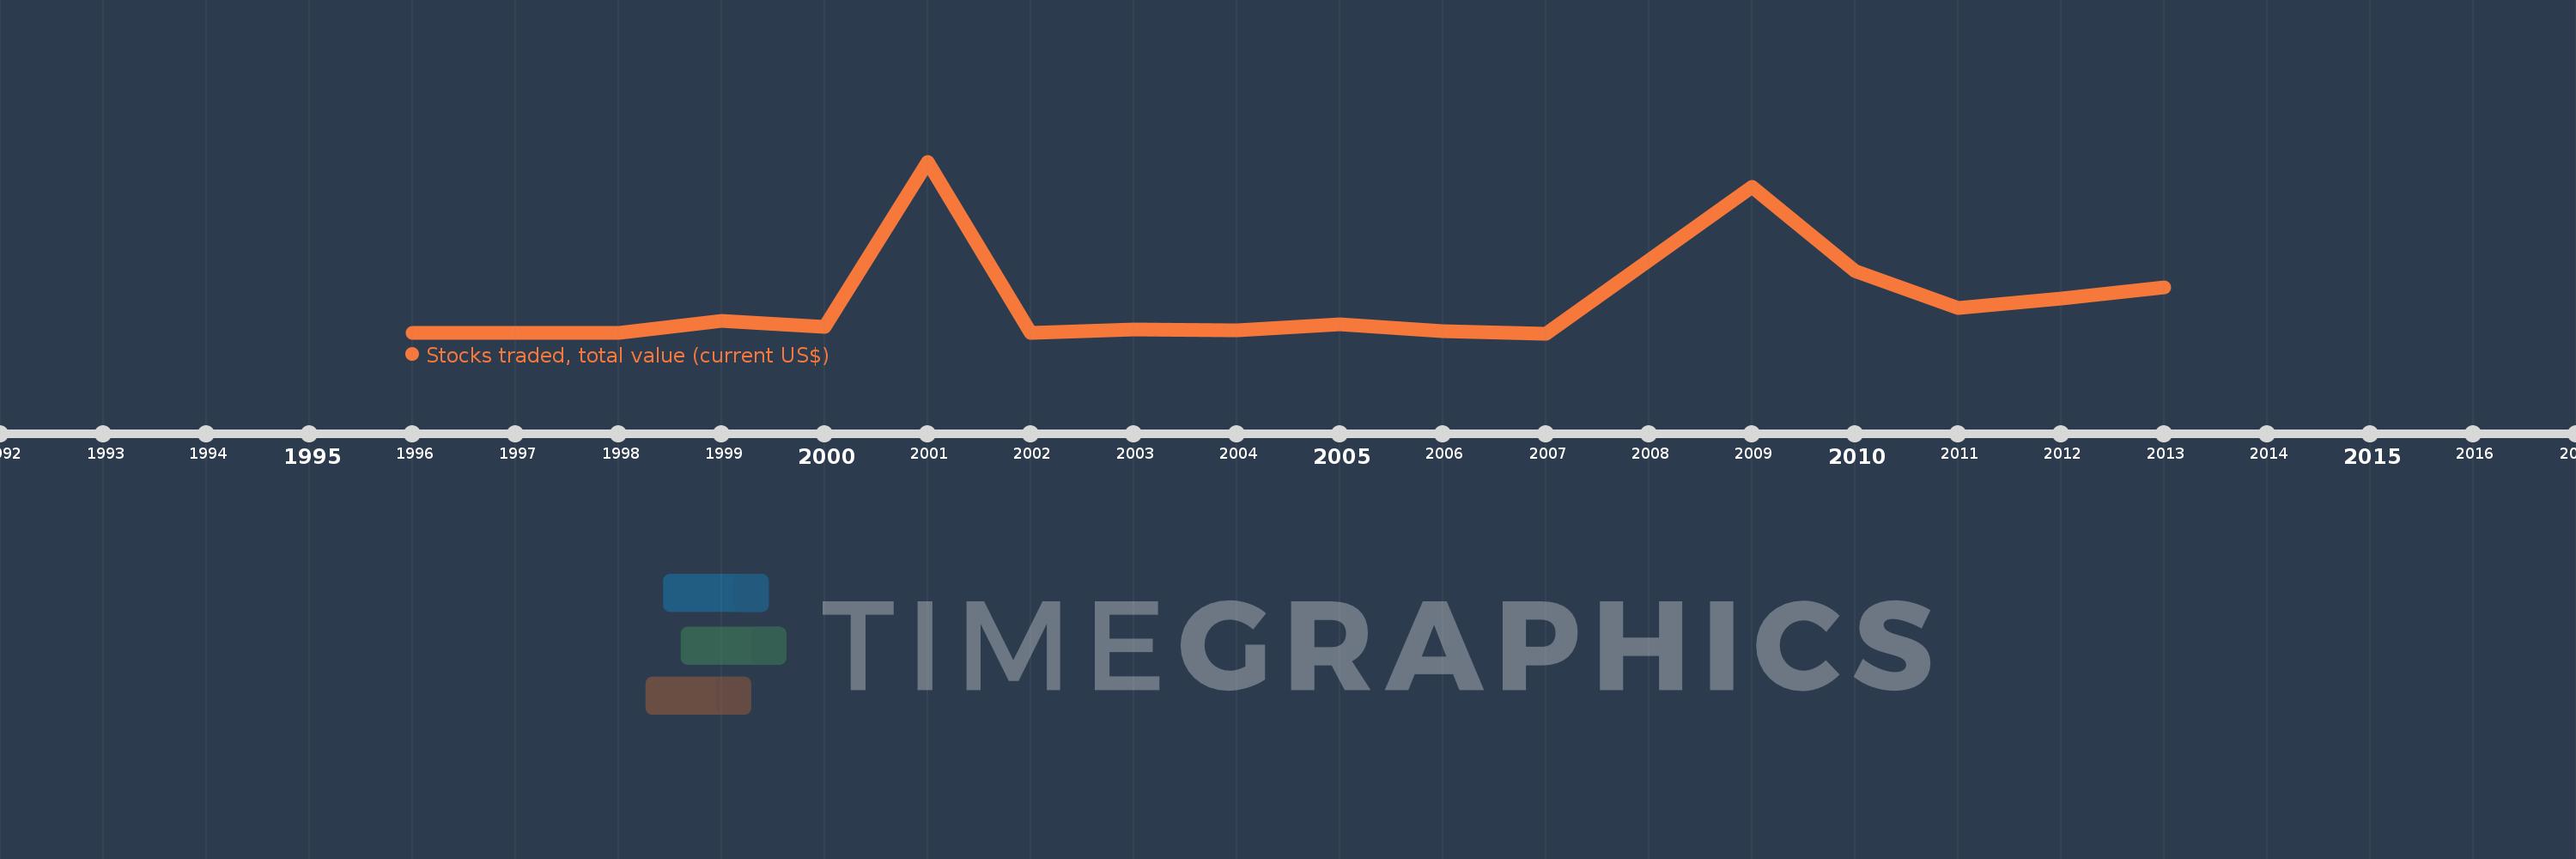
Stocks traded, total value (current US$)
2013,2012,2011,2010,2009,2007,2006,2005,2004,2003,2002,2001,2000,1999,1998,1997,1996
This statistics in other country:
Timeline:
This timeline shows a graph from 1996 to 2013 of Bolivia. No data until 1995. Number of actual observations by date: 17.
Source name:
World Development Indicators
Source organization:
World Federation of Exchanges database.
Categories, topics:
Financial Sector
Last updated:
apr 23, 2017
Indicators value changes by year
Minimum:
942.326K
jan 1, 2007
Maximum:
69.531 mln
jan 1, 2001
At the date of observation
Value
Absolute change
Change from previous value
jan 1, 1996
1000.0K
+1000.0K
0.0%
jan 1, 1997
1000.0K
0.0
0.0%
jan 1, 1998
1000.0K
0.0
0.0%
jan 1, 1999
6.0 mln
+5.0 mln
500.0%
jan 1, 2000
3.348 mln
-2.652 mln
-44.19%
jan 1, 2001
69.531 mln
+66.183 mln
1.98K%
jan 1, 2002
1.272 mln
-68.259 mln
-98.17%
jan 1, 2003
2.39 mln
+1.117 mln
87.84%
jan 1, 2004
2.236 mln
-153.126K
-6.41%
jan 1, 2005
4.472 mln
+2.235 mln
99.94%
jan 1, 2006
1.698 mln
-2.774 mln
-62.02%
jan 1, 2007
942.326K
-755.822K
-44.51%
jan 1, 2009
59.43 mln
+58.488 mln
6.21K%
jan 1, 2010
25.91 mln
-33.52 mln
-56.4%
jan 1, 2011
11.0 mln
-14.91 mln
-57.55%
jan 1, 2012
14.94 mln
+3.94 mln
35.82%
jan 1, 2013
19.34 mln
+4.4 mln
29.45%
Ranking of countries by current statistics by years


Comments: