29
/
en
AIzaSyAYiBZKx7MnpbEhh9jyipgxe19OcubqV5w
April 1, 2024
261637
Tanzania
TZA
true
2
1
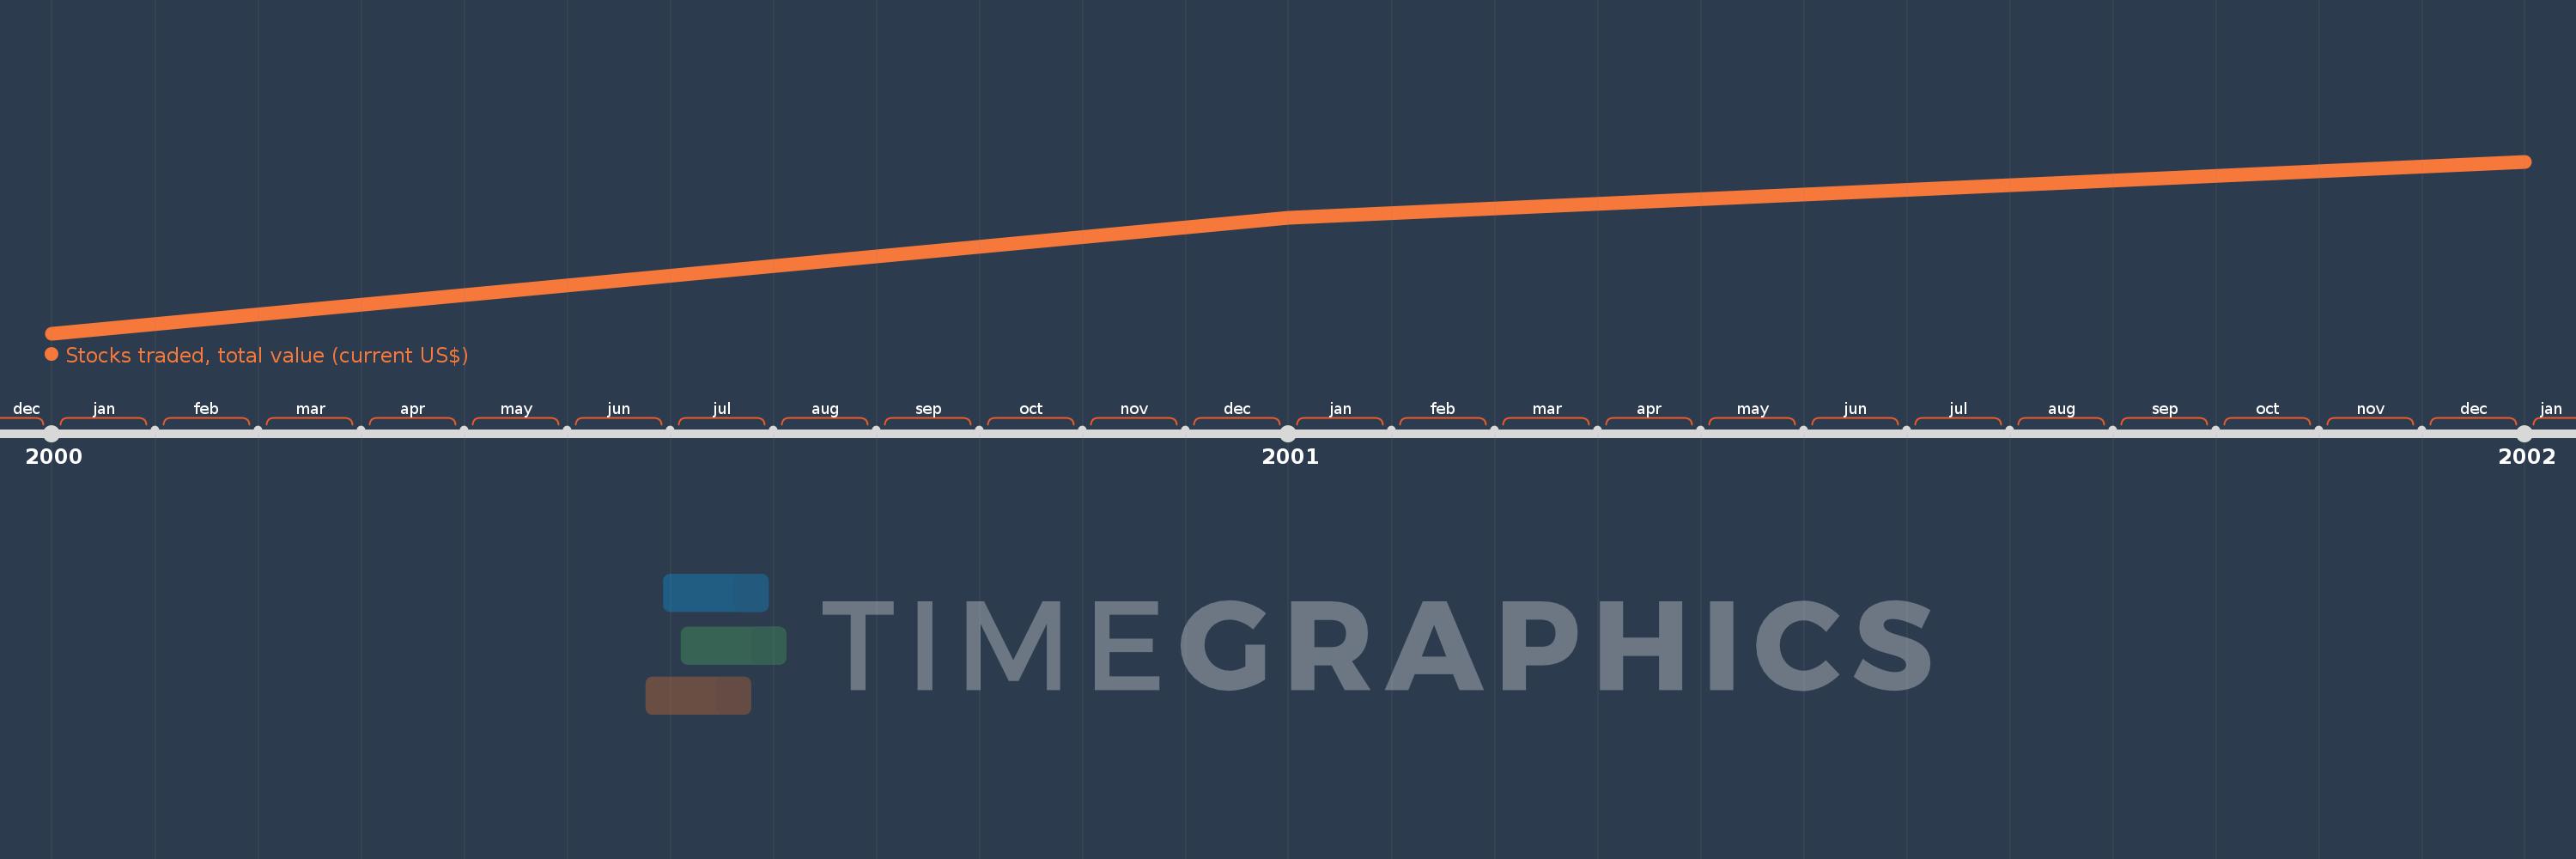
Stocks traded, total value (current US$)
2002,2001,2000
This statistics in other country:
Timeline:
This timeline shows a graph from 2000 to 2002 of Tanzania. No data until 1999. Number of actual observations by date: 3.
Source name:
World Development Indicators
Source organization:
World Federation of Exchanges database.
Categories, topics:
Financial Sector
Last updated:
apr 23, 2017
Indicators value changes by year
Maximum:
7.13 mln
jan 1, 2002
At the date of observation
Value
Absolute change
Change from previous value
jan 1, 2000
40.0K
+40.0K
0.0%
jan 1, 2001
4.8 mln
+4.76 mln
11.9K%
jan 1, 2002
7.13 mln
+2.33 mln
48.54%
Ranking of countries by current statistics by years


Comments: