29
/
en
AIzaSyAYiBZKx7MnpbEhh9jyipgxe19OcubqV5w
April 1, 2024
90036
Botswana
BWA
true
2
1
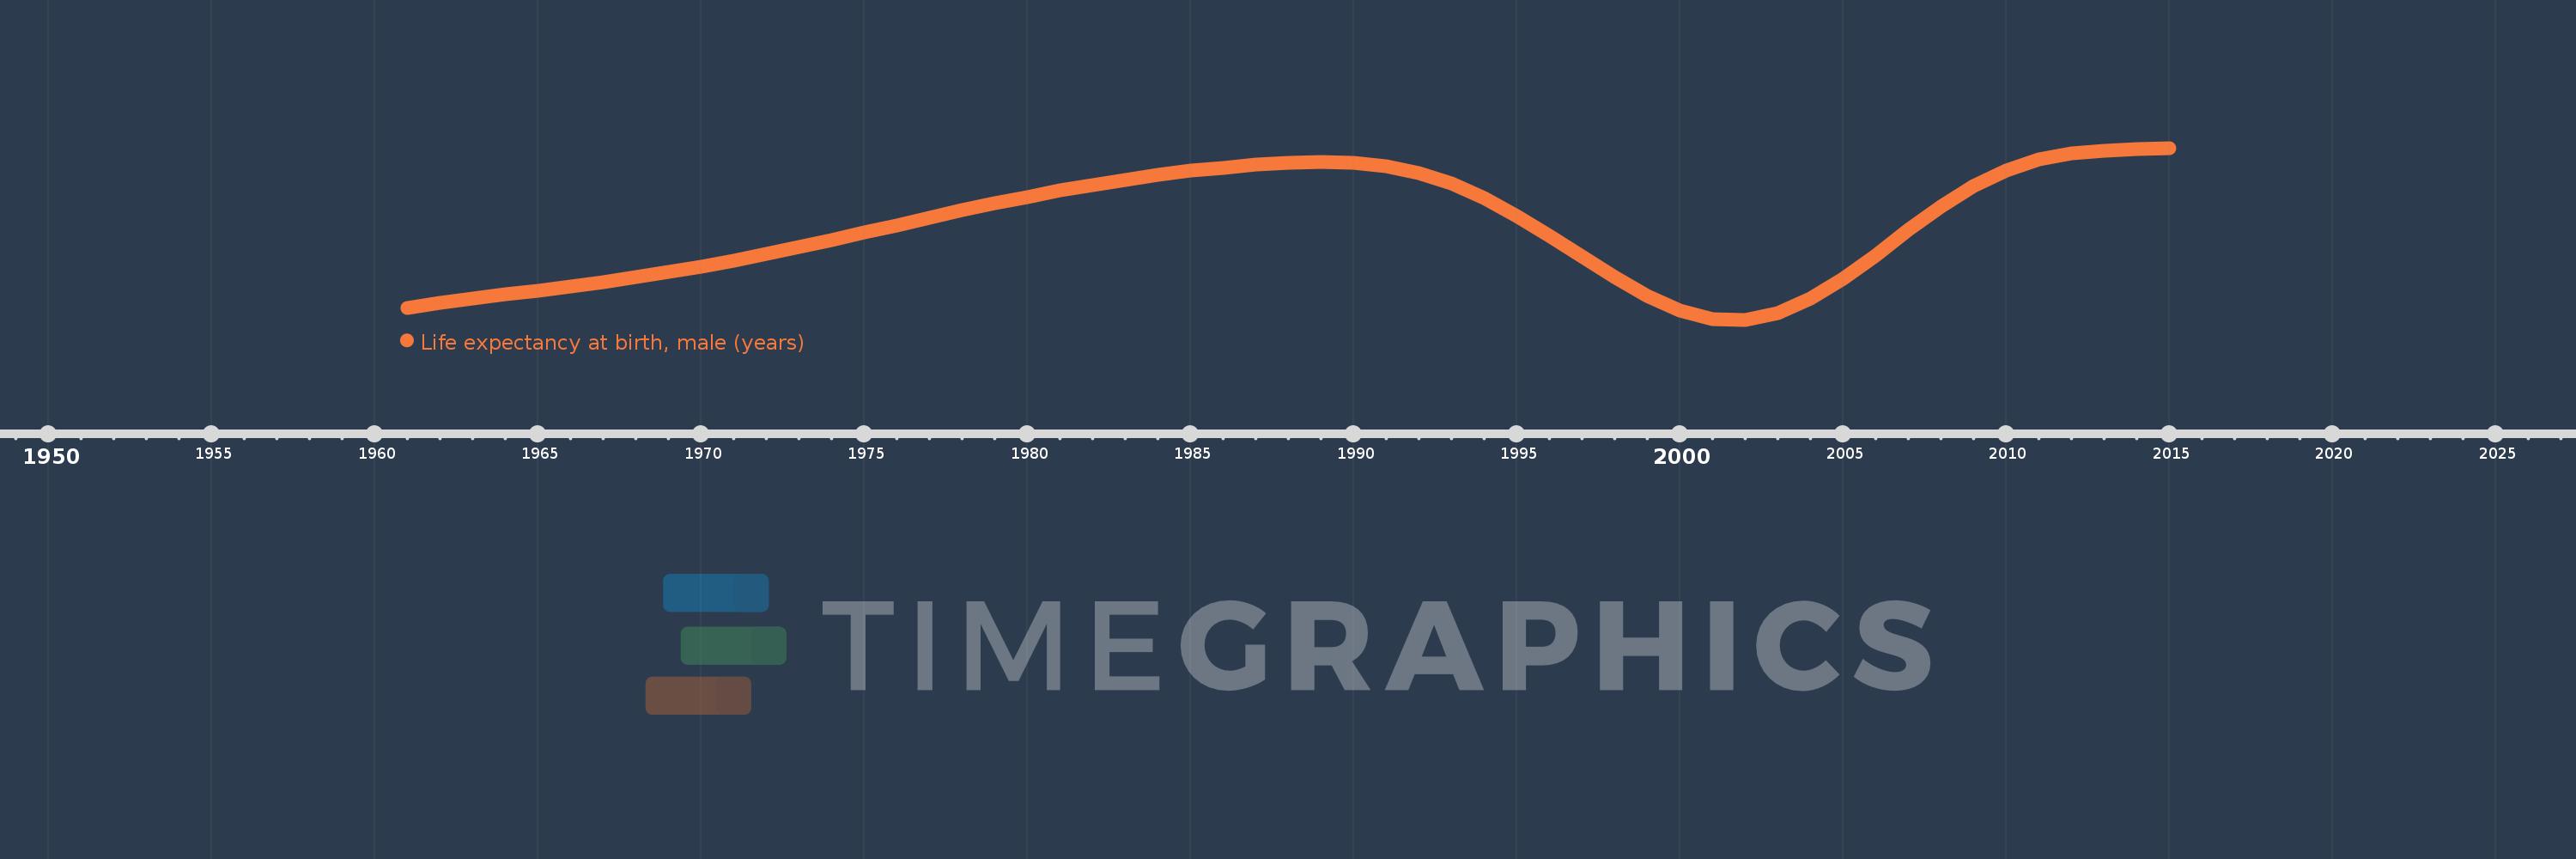
Life expectancy at birth, male (years)
2015,2014,2013,2012,2011,2010,2009,2008,2007,2006,2005,2004,2003,2002,2001,2000,1999,1998,1997,1996,1995,1994,1993,1992,1991,1990,1989,1988,1987,1986,1985,1984,1983,1982,1981,1980,1979,1978,1977,1976,1975,1974,1973,1972,1971,1970,1969,1968,1967,1966,1965,1964,1963,1962,1961
This statistics in other country:
AfghanistanAlbaniaAlgeriaAngolaAntigua and BarbudaArab WorldArgentinaArmeniaArubaAustraliaAustriaAzerbaijanBahamas, TheBahrainBangladeshBarbadosBelarusBelgiumBelizeBeninBermudaBhutanBoliviaBosnia and HerzegovinaBotswanaBrazilBrunei DarussalamBulgariaBurkina FasoBurundiCabo VerdeCambodiaCameroonCanadaCaribbean small statesCentral African RepublicCentral Europe and the BalticsChadChannel IslandsChileChinaColombiaComorosCongo, Dem. Rep.Congo, Rep.Costa RicaCote d'IvoireCroatiaCubaCuracaoCyprusCzech RepublicDenmarkDjiboutiDominicaDominican RepublicEarly-demographic dividendEast Asia & PacificEast Asia & Pacific (excluding high income)East Asia & Pacific (IDA & IBRD countries)EcuadorEgypt, Arab Rep.El SalvadorEquatorial GuineaEritreaEstoniaEthiopiaEuro areaEurope & Central AsiaEurope & Central Asia (excluding high income)Europe & Central Asia (IDA & IBRD countries)European UnionFaroe IslandsFijiFinlandFragile and conflict affected situationsFranceFrench PolynesiaGabonGambia, TheGeorgiaGermanyGhanaGreeceGreenlandGrenadaGuamGuatemalaGuineaGuinea-BissauGuyanaHaitiHeavily indebted poor countries (HIPC)High incomeHondurasHong Kong SAR, ChinaHungaryIBRD onlyIcelandIDA & IBRD totalIDA blendIDA onlyIDA totalIndiaIndonesiaIran, Islamic Rep.IraqIrelandIsle of ManIsraelItalyJamaicaJapanJordanKazakhstanKenyaKiribatiKorea, Dem. People’s Rep.Korea, Rep.KosovoKuwaitKyrgyz RepublicLao PDRLate-demographic dividendLatin America & Caribbean Latin America & Caribbean (excluding high income)Latin America & the Caribbean (IDA & IBRD countries)LatviaLeast developed countries: UN classificationLebanonLesothoLiberiaLibyaLiechtensteinLithuaniaLow & middle incomeLow incomeLower middle incomeLuxembourgMacao SAR, ChinaMacedonia, FYRMadagascarMalawiMalaysiaMaldivesMaliMaltaMarshall IslandsMauritaniaMauritiusMexicoMicronesia, Fed. Sts.Middle East & North AfricaMiddle East & North Africa (excluding high income)Middle East & North Africa (IDA & IBRD countries)Middle incomeMoldovaMongoliaMontenegroMoroccoMozambiqueMyanmarNamibiaNepalNetherlandsNew CaledoniaNew ZealandNicaraguaNigerNigeriaNorth AmericaNorwayOECD membersOmanOther small statesPacific island small statesPakistanPalauPanamaPapua New GuineaParaguayPeruPhilippinesPolandPortugalPost-demographic dividendPre-demographic dividendPuerto RicoQatarRomaniaRussian FederationRwandaSamoaSan MarinoSao Tome and PrincipeSaudi ArabiaSenegalSerbiaSeychellesSierra LeoneSingaporeSint Maarten (Dutch part)Slovak RepublicSloveniaSmall statesSolomon IslandsSomaliaSouth AfricaSouth AsiaSouth Asia (IDA & IBRD)South SudanSpainSri LankaSt. Kitts and NevisSt. LuciaSt. Martin (French part)St. Vincent and the GrenadinesSub-Saharan Africa Sub-Saharan Africa (excluding high income)Sub-Saharan Africa (IDA & IBRD countries)SudanSurinameSwazilandSwedenSwitzerlandSyrian Arab RepublicTajikistanTanzaniaThailandTimor-LesteTogoTongaTrinidad and TobagoTunisiaTurkeyTurkmenistanUgandaUkraineUnited Arab EmiratesUnited KingdomUnited StatesUpper middle incomeUruguayUzbekistanVanuatuVenezuela, RBVietnamVirgin Islands (U.S.)West Bank and GazaWorldYemen, Rep.ZambiaZimbabwe Timeline:
This timeline shows a graph from 1961 to 2015 of Botswana. No data until 1960. Number of actual observations by date: 55.
Source name:
World Development Indicators
Source organization:
(1) United Nations Population Division. World Population Prospects, (2) Census reports and other statistical publications from national statistical offices, (3) Eurostat: Demographic Statistics, (4) United Nations Statistical Division. Population and Vital Statistics Reprot (various years), (5) U.S. Census Bureau: International Database, and (6) Secretariat of the Pacific Community: Statistics and Demography Programme.
Categories, topics:
Health, Gender, Social Development
Last updated:
apr 23, 2017
Indicators value changes by year
Minimum:
47.743
jan 1, 2002
Maximum:
62.139
jan 1, 2015
At the date of observation
Value
Absolute change
Change from previous value
jan 1, 1961
48.757
+48.757
0.0%
jan 1, 1962
49.133
+0.376
0.77%
jan 1, 1963
49.496
+0.363
0.74%
jan 1, 1964
49.85
+0.354
0.72%
jan 1, 1965
50.199
+0.349
0.7%
jan 1, 1966
50.554
+0.355
0.71%
jan 1, 1967
50.924
+0.37
0.73%
jan 1, 1968
51.318
+0.394
0.77%
jan 1, 1969
51.743
+0.425
0.83%
jan 1, 1970
52.203
+0.46
0.89%
jan 1, 1971
52.702
+0.499
0.96%
jan 1, 1972
53.244
+0.542
1.03%
jan 1, 1973
53.822
+0.578
1.09%
jan 1, 1974
54.424
+0.602
1.12%
jan 1, 1975
55.042
+0.618
1.14%
jan 1, 1976
55.667
+0.625
1.14%
jan 1, 1977
56.289
+0.622
1.12%
jan 1, 1978
56.9
+0.611
1.09%
jan 1, 1979
57.489
+0.589
1.04%
jan 1, 1980
58.043
+0.554
0.96%
jan 1, 1981
58.559
+0.516
0.89%
jan 1, 1982
59.038
+0.479
0.82%
jan 1, 1983
59.479
+0.441
0.75%
jan 1, 1984
59.876
+0.397
0.67%
jan 1, 1985
60.215
+0.339
0.57%
jan 1, 1986
60.496
+0.281
0.47%
jan 1, 1987
60.723
+0.227
0.38%
jan 1, 1988
60.883
+0.16
0.26%
jan 1, 1989
60.951
+0.068
0.11%
jan 1, 1990
60.891
-0.06
-0.1%
jan 1, 1991
60.62
-0.271
-0.45%
jan 1, 1992
60.045
-0.575
-0.95%
jan 1, 1993
59.138
-0.907
-1.51%
jan 1, 1994
57.918
-1.22
-2.06%
jan 1, 1995
56.443
-1.475
-2.55%
jan 1, 1996
54.781
-1.662
-2.94%
jan 1, 1997
53.021
-1.76
-3.21%
jan 1, 1998
51.299
-1.722
-3.25%
jan 1, 1999
49.766
-1.533
-2.99%
jan 1, 2000
48.546
-1.22
-2.45%
jan 1, 2001
47.819
-0.727
-1.5%
jan 1, 2002
47.743
-0.076
-0.16%
jan 1, 2003
48.32
+0.577
1.21%
jan 1, 2004
49.485
+1.165
2.41%
jan 1, 2005
51.149
+1.664
3.36%
jan 1, 2006
53.141
+1.992
3.89%
jan 1, 2007
55.244
+2.103
3.96%
jan 1, 2008
57.237
+1.993
3.61%
jan 1, 2009
58.942
+1.705
2.98%
jan 1, 2010
60.261
+1.319
2.24%
jan 1, 2011
61.154
+0.893
1.48%
jan 1, 2012
61.656
+0.502
0.82%
jan 1, 2013
61.912
+0.256
0.42%
jan 1, 2014
62.053
+0.141
0.23%
jan 1, 2015
62.139
+0.086
0.14%
Ranking of countries by current statistics by years


Comments: