29
/
en
AIzaSyAYiBZKx7MnpbEhh9jyipgxe19OcubqV5w
April 1, 2024
239514
Sierra Leone
SLE
true
2
1
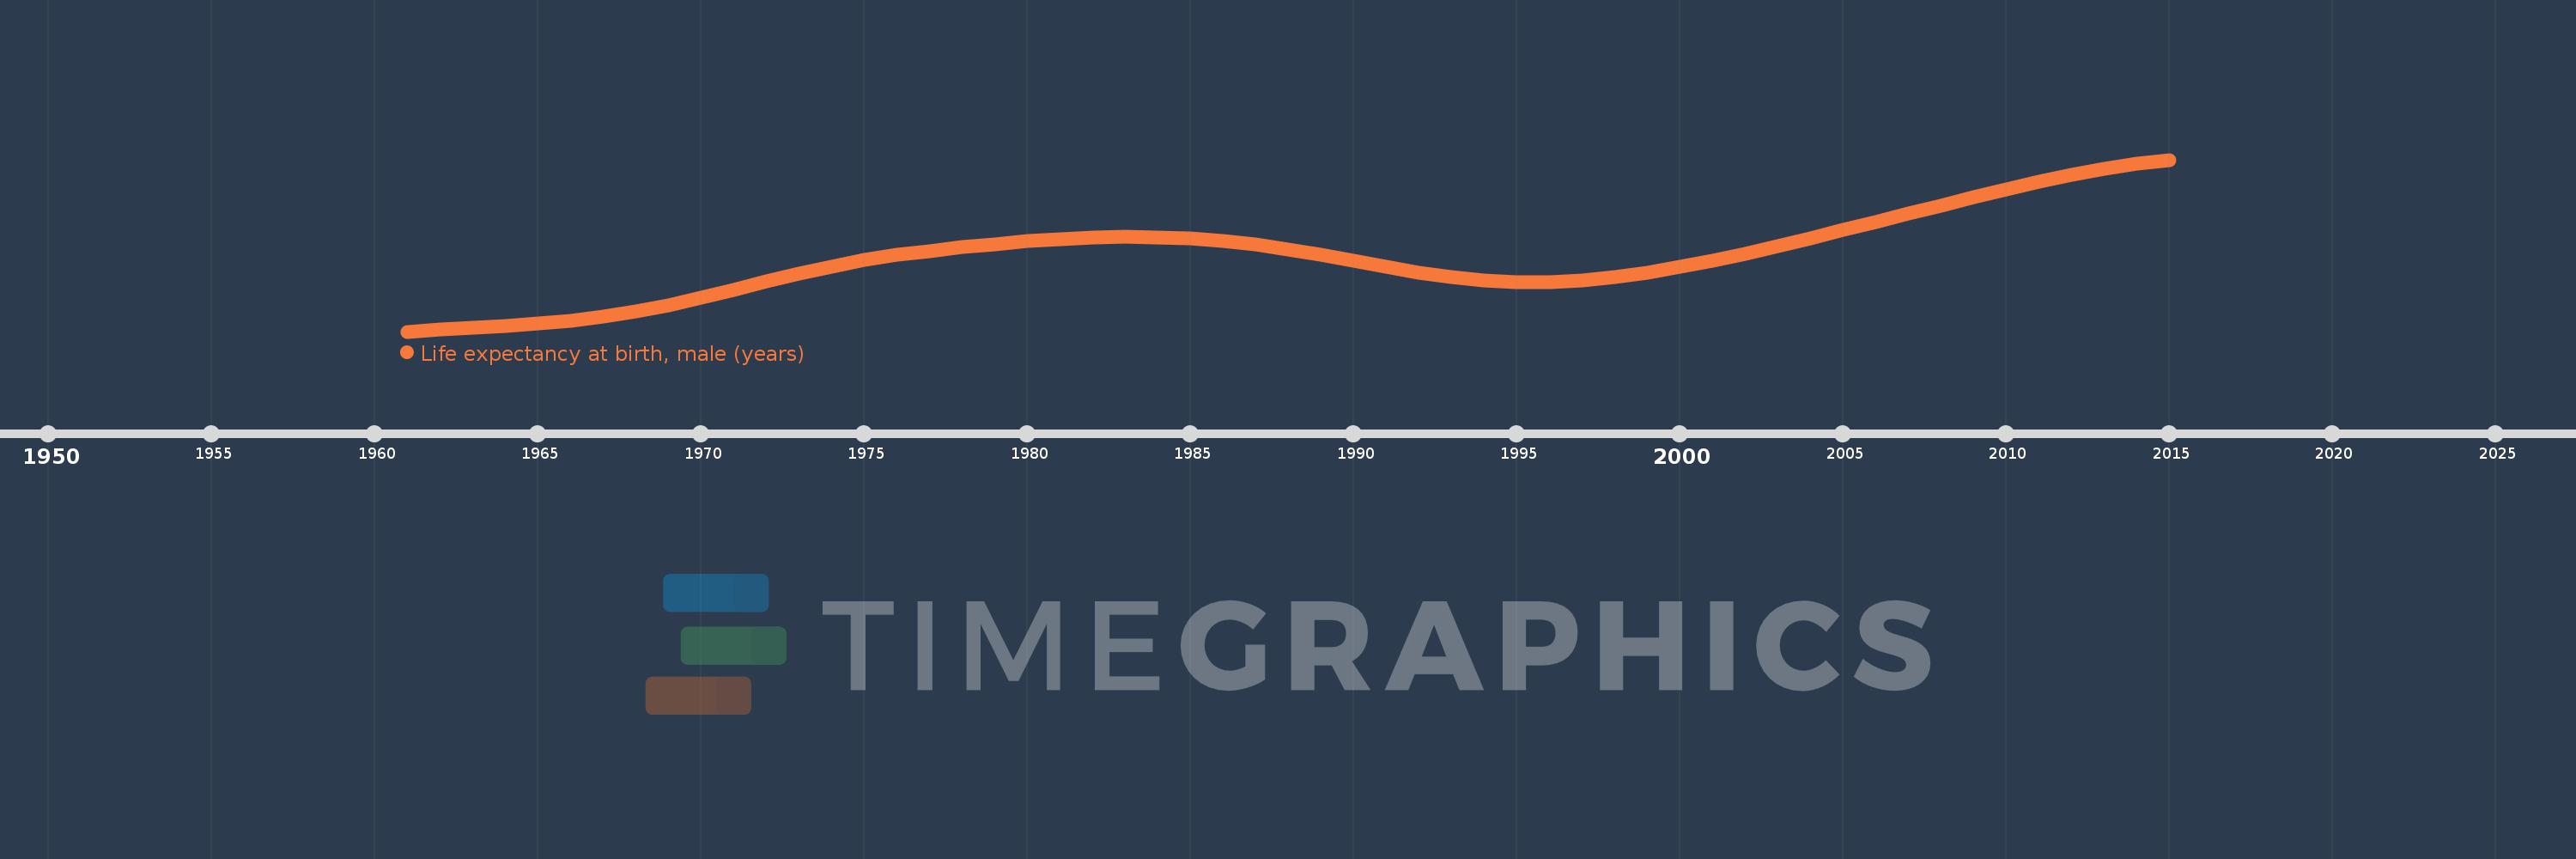
Life expectancy at birth, male (years)
2015,2014,2013,2012,2011,2010,2009,2008,2007,2006,2005,2004,2003,2002,2001,2000,1999,1998,1997,1996,1995,1994,1993,1992,1991,1990,1989,1988,1987,1986,1985,1984,1983,1982,1981,1980,1979,1978,1977,1976,1975,1974,1973,1972,1971,1970,1969,1968,1967,1966,1965,1964,1963,1962,1961
This statistics in other country:
AfghanistanAlbaniaAlgeriaAngolaAntigua and BarbudaArab WorldArgentinaArmeniaArubaAustraliaAustriaAzerbaijanBahamas, TheBahrainBangladeshBarbadosBelarusBelgiumBelizeBeninBermudaBhutanBoliviaBosnia and HerzegovinaBotswanaBrazilBrunei DarussalamBulgariaBurkina FasoBurundiCabo VerdeCambodiaCameroonCanadaCaribbean small statesCentral African RepublicCentral Europe and the BalticsChadChannel IslandsChileChinaColombiaComorosCongo, Dem. Rep.Congo, Rep.Costa RicaCote d'IvoireCroatiaCubaCuracaoCyprusCzech RepublicDenmarkDjiboutiDominicaDominican RepublicEarly-demographic dividendEast Asia & PacificEast Asia & Pacific (excluding high income)East Asia & Pacific (IDA & IBRD countries)EcuadorEgypt, Arab Rep.El SalvadorEquatorial GuineaEritreaEstoniaEthiopiaEuro areaEurope & Central AsiaEurope & Central Asia (excluding high income)Europe & Central Asia (IDA & IBRD countries)European UnionFaroe IslandsFijiFinlandFragile and conflict affected situationsFranceFrench PolynesiaGabonGambia, TheGeorgiaGermanyGhanaGreeceGreenlandGrenadaGuamGuatemalaGuineaGuinea-BissauGuyanaHaitiHeavily indebted poor countries (HIPC)High incomeHondurasHong Kong SAR, ChinaHungaryIBRD onlyIcelandIDA & IBRD totalIDA blendIDA onlyIDA totalIndiaIndonesiaIran, Islamic Rep.IraqIrelandIsle of ManIsraelItalyJamaicaJapanJordanKazakhstanKenyaKiribatiKorea, Dem. People’s Rep.Korea, Rep.KosovoKuwaitKyrgyz RepublicLao PDRLate-demographic dividendLatin America & Caribbean Latin America & Caribbean (excluding high income)Latin America & the Caribbean (IDA & IBRD countries)LatviaLeast developed countries: UN classificationLebanonLesothoLiberiaLibyaLiechtensteinLithuaniaLow & middle incomeLow incomeLower middle incomeLuxembourgMacao SAR, ChinaMacedonia, FYRMadagascarMalawiMalaysiaMaldivesMaliMaltaMarshall IslandsMauritaniaMauritiusMexicoMicronesia, Fed. Sts.Middle East & North AfricaMiddle East & North Africa (excluding high income)Middle East & North Africa (IDA & IBRD countries)Middle incomeMoldovaMongoliaMontenegroMoroccoMozambiqueMyanmarNamibiaNepalNetherlandsNew CaledoniaNew ZealandNicaraguaNigerNigeriaNorth AmericaNorwayOECD membersOmanOther small statesPacific island small statesPakistanPalauPanamaPapua New GuineaParaguayPeruPhilippinesPolandPortugalPost-demographic dividendPre-demographic dividendPuerto RicoQatarRomaniaRussian FederationRwandaSamoaSan MarinoSao Tome and PrincipeSaudi ArabiaSenegalSerbiaSeychellesSierra LeoneSingaporeSint Maarten (Dutch part)Slovak RepublicSloveniaSmall statesSolomon IslandsSomaliaSouth AfricaSouth AsiaSouth Asia (IDA & IBRD)South SudanSpainSri LankaSt. Kitts and NevisSt. LuciaSt. Martin (French part)St. Vincent and the GrenadinesSub-Saharan Africa Sub-Saharan Africa (excluding high income)Sub-Saharan Africa (IDA & IBRD countries)SudanSurinameSwazilandSwedenSwitzerlandSyrian Arab RepublicTajikistanTanzaniaThailandTimor-LesteTogoTongaTrinidad and TobagoTunisiaTurkeyTurkmenistanUgandaUkraineUnited Arab EmiratesUnited KingdomUnited StatesUpper middle incomeUruguayUzbekistanVanuatuVenezuela, RBVietnamVirgin Islands (U.S.)West Bank and GazaWorldYemen, Rep.ZambiaZimbabwe Timeline:
This timeline shows a graph from 1961 to 2015 of Sierra Leone. No data until 1960. Number of actual observations by date: 55.
Source name:
World Development Indicators
Source organization:
(1) United Nations Population Division. World Population Prospects, (2) Census reports and other statistical publications from national statistical offices, (3) Eurostat: Demographic Statistics, (4) United Nations Statistical Division. Population and Vital Statistics Reprot (various years), (5) U.S. Census Bureau: International Database, and (6) Secretariat of the Pacific Community: Statistics and Demography Programme.
Categories, topics:
Health, Gender, Social Development
Last updated:
apr 23, 2017
Indicators value changes by year
Minimum:
28.773
jan 1, 1961
At the date of observation
Value
Absolute change
Change from previous value
jan 1, 1961
28.773
+28.773
0.0%
jan 1, 1962
29.018
+0.245
0.85%
jan 1, 1963
29.264
+0.246
0.85%
jan 1, 1964
29.52
+0.256
0.87%
jan 1, 1965
29.806
+0.286
0.97%
jan 1, 1966
30.168
+0.362
1.21%
jan 1, 1967
30.657
+0.489
1.62%
jan 1, 1968
31.296
+0.639
2.08%
jan 1, 1969
32.085
+0.789
2.52%
jan 1, 1970
33.006
+0.921
2.87%
jan 1, 1971
34.013
+1.007
3.05%
jan 1, 1972
35.048
+1.035
3.04%
jan 1, 1973
36.045
+0.997
2.84%
jan 1, 1974
36.949
+0.904
2.51%
jan 1, 1975
37.728
+0.779
2.11%
jan 1, 1976
38.376
+0.648
1.72%
jan 1, 1977
38.909
+0.533
1.39%
jan 1, 1978
39.363
+0.454
1.17%
jan 1, 1979
39.763
+0.4
1.02%
jan 1, 1980
40.106
+0.343
0.86%
jan 1, 1981
40.38
+0.274
0.68%
jan 1, 1982
40.566
+0.186
0.46%
jan 1, 1983
40.645
+0.079
0.19%
jan 1, 1984
40.605
-0.04
-0.1%
jan 1, 1985
40.441
-0.164
-0.4%
jan 1, 1986
40.137
-0.304
-0.75%
jan 1, 1987
39.677
-0.46
-1.15%
jan 1, 1988
39.077
-0.6
-1.51%
jan 1, 1989
38.377
-0.7
-1.79%
jan 1, 1990
37.622
-0.755
-1.97%
jan 1, 1991
36.87
-0.752
-2.0%
jan 1, 1992
36.182
-0.688
-1.87%
jan 1, 1993
35.61
-0.572
-1.58%
jan 1, 1994
35.196
-0.414
-1.16%
jan 1, 1995
34.977
-0.219
-0.62%
jan 1, 1996
34.976
-0.001
0.0%
jan 1, 1997
35.2
+0.224
0.64%
jan 1, 1998
35.614
+0.414
1.18%
jan 1, 1999
36.179
+0.565
1.59%
jan 1, 2000
36.874
+0.695
1.92%
jan 1, 2001
37.676
+0.802
2.17%
jan 1, 2002
38.565
+0.889
2.36%
jan 1, 2003
39.519
+0.954
2.47%
jan 1, 2004
40.514
+0.995
2.52%
jan 1, 2005
41.527
+1.013
2.5%
jan 1, 2006
42.546
+1.019
2.45%
jan 1, 2007
43.571
+1.025
2.41%
jan 1, 2008
44.603
+1.032
2.37%
jan 1, 2009
45.633
+1.03
2.31%
jan 1, 2010
46.639
+1.006
2.2%
jan 1, 2011
47.587
+0.948
2.03%
jan 1, 2012
48.444
+0.857
1.8%
jan 1, 2013
49.193
+0.749
1.55%
jan 1, 2014
49.828
+0.635
1.29%
jan 1, 2015
50.35
+0.522
1.05%
Ranking of countries by current statistics by years


Comments: