29
/
en
AIzaSyAYiBZKx7MnpbEhh9jyipgxe19OcubqV5w
April 1, 2024
72338
Aruba
ABW
true
2
1
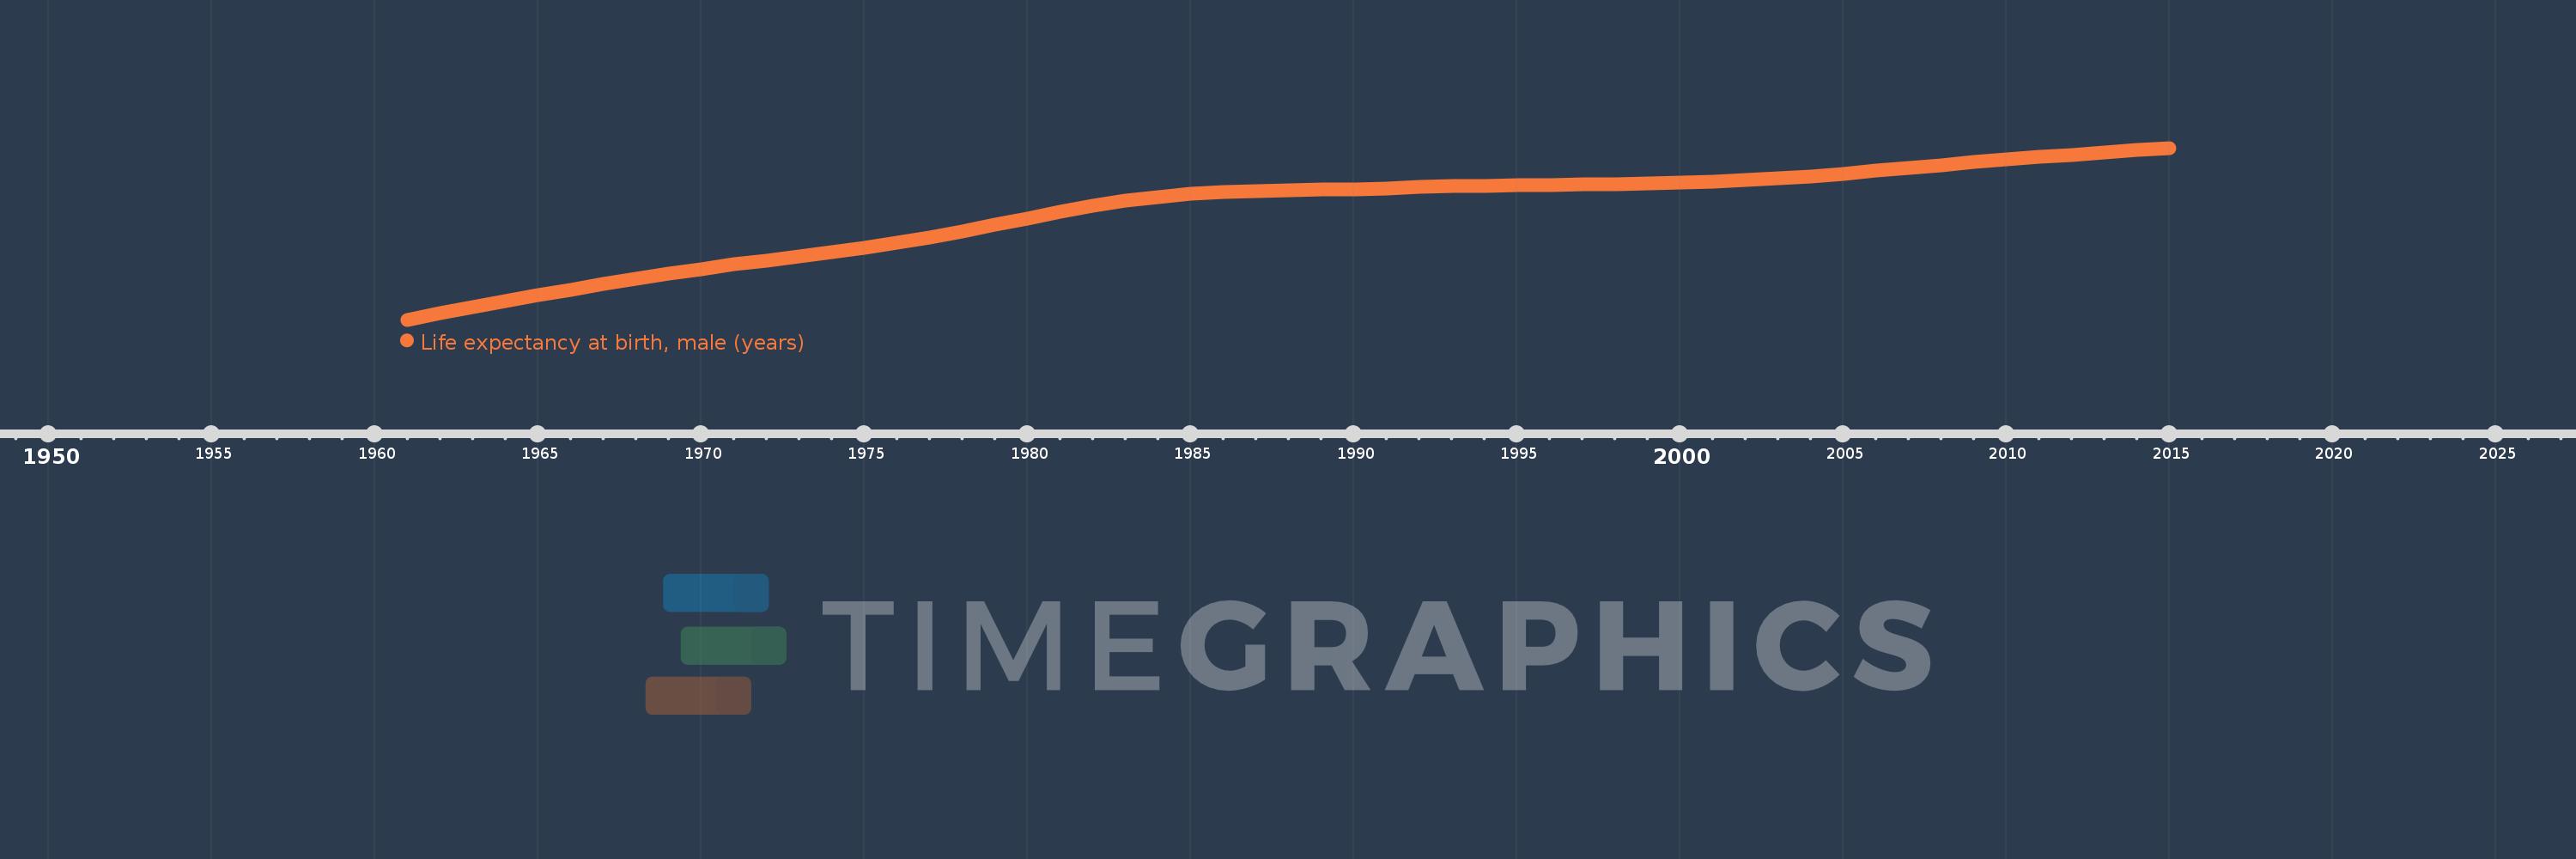
Life expectancy at birth, male (years)
2015,2014,2013,2012,2011,2010,2009,2008,2007,2006,2005,2004,2003,2002,2001,2000,1999,1998,1997,1996,1995,1994,1993,1992,1991,1990,1989,1988,1987,1986,1985,1984,1983,1982,1981,1980,1979,1978,1977,1976,1975,1974,1973,1972,1971,1970,1969,1968,1967,1966,1965,1964,1963,1962,1961
This statistics in other country:
AfghanistanAlbaniaAlgeriaAngolaAntigua and BarbudaArab WorldArgentinaArmeniaArubaAustraliaAustriaAzerbaijanBahamas, TheBahrainBangladeshBarbadosBelarusBelgiumBelizeBeninBermudaBhutanBoliviaBosnia and HerzegovinaBotswanaBrazilBrunei DarussalamBulgariaBurkina FasoBurundiCabo VerdeCambodiaCameroonCanadaCaribbean small statesCentral African RepublicCentral Europe and the BalticsChadChannel IslandsChileChinaColombiaComorosCongo, Dem. Rep.Congo, Rep.Costa RicaCote d'IvoireCroatiaCubaCuracaoCyprusCzech RepublicDenmarkDjiboutiDominicaDominican RepublicEarly-demographic dividendEast Asia & PacificEast Asia & Pacific (excluding high income)East Asia & Pacific (IDA & IBRD countries)EcuadorEgypt, Arab Rep.El SalvadorEquatorial GuineaEritreaEstoniaEthiopiaEuro areaEurope & Central AsiaEurope & Central Asia (excluding high income)Europe & Central Asia (IDA & IBRD countries)European UnionFaroe IslandsFijiFinlandFragile and conflict affected situationsFranceFrench PolynesiaGabonGambia, TheGeorgiaGermanyGhanaGreeceGreenlandGrenadaGuamGuatemalaGuineaGuinea-BissauGuyanaHaitiHeavily indebted poor countries (HIPC)High incomeHondurasHong Kong SAR, ChinaHungaryIBRD onlyIcelandIDA & IBRD totalIDA blendIDA onlyIDA totalIndiaIndonesiaIran, Islamic Rep.IraqIrelandIsle of ManIsraelItalyJamaicaJapanJordanKazakhstanKenyaKiribatiKorea, Dem. People’s Rep.Korea, Rep.KosovoKuwaitKyrgyz RepublicLao PDRLate-demographic dividendLatin America & Caribbean Latin America & Caribbean (excluding high income)Latin America & the Caribbean (IDA & IBRD countries)LatviaLeast developed countries: UN classificationLebanonLesothoLiberiaLibyaLiechtensteinLithuaniaLow & middle incomeLow incomeLower middle incomeLuxembourgMacao SAR, ChinaMacedonia, FYRMadagascarMalawiMalaysiaMaldivesMaliMaltaMarshall IslandsMauritaniaMauritiusMexicoMicronesia, Fed. Sts.Middle East & North AfricaMiddle East & North Africa (excluding high income)Middle East & North Africa (IDA & IBRD countries)Middle incomeMoldovaMongoliaMontenegroMoroccoMozambiqueMyanmarNamibiaNepalNetherlandsNew CaledoniaNew ZealandNicaraguaNigerNigeriaNorth AmericaNorwayOECD membersOmanOther small statesPacific island small statesPakistanPalauPanamaPapua New GuineaParaguayPeruPhilippinesPolandPortugalPost-demographic dividendPre-demographic dividendPuerto RicoQatarRomaniaRussian FederationRwandaSamoaSan MarinoSao Tome and PrincipeSaudi ArabiaSenegalSerbiaSeychellesSierra LeoneSingaporeSint Maarten (Dutch part)Slovak RepublicSloveniaSmall statesSolomon IslandsSomaliaSouth AfricaSouth AsiaSouth Asia (IDA & IBRD)South SudanSpainSri LankaSt. Kitts and NevisSt. LuciaSt. Martin (French part)St. Vincent and the GrenadinesSub-Saharan Africa Sub-Saharan Africa (excluding high income)Sub-Saharan Africa (IDA & IBRD countries)SudanSurinameSwazilandSwedenSwitzerlandSyrian Arab RepublicTajikistanTanzaniaThailandTimor-LesteTogoTongaTrinidad and TobagoTunisiaTurkeyTurkmenistanUgandaUkraineUnited Arab EmiratesUnited KingdomUnited StatesUpper middle incomeUruguayUzbekistanVanuatuVenezuela, RBVietnamVirgin Islands (U.S.)West Bank and GazaWorldYemen, Rep.ZambiaZimbabwe Timeline:
This timeline shows a graph from 1961 to 2015 of Aruba. No data until 1960. Number of actual observations by date: 55.
Source name:
World Development Indicators
Source organization:
(1) United Nations Population Division. World Population Prospects, (2) Census reports and other statistical publications from national statistical offices, (3) Eurostat: Demographic Statistics, (4) United Nations Statistical Division. Population and Vital Statistics Reprot (various years), (5) U.S. Census Bureau: International Database, and (6) Secretariat of the Pacific Community: Statistics and Demography Programme.
Categories, topics:
Health, Gender, Social Development
Last updated:
apr 23, 2017
Indicators value changes by year
Minimum:
64.084
jan 1, 1961
Maximum:
73.075
jan 1, 2015
At the date of observation
Value
Absolute change
Change from previous value
jan 1, 1961
64.084
+64.084
0.0%
jan 1, 1962
64.429
+0.345
0.54%
jan 1, 1963
64.747
+0.318
0.49%
jan 1, 1964
65.053
+0.306
0.47%
jan 1, 1965
65.356
+0.303
0.47%
jan 1, 1966
65.66
+0.304
0.47%
jan 1, 1967
65.959
+0.299
0.46%
jan 1, 1968
66.242
+0.283
0.43%
jan 1, 1969
66.503
+0.261
0.39%
jan 1, 1970
66.745
+0.242
0.36%
jan 1, 1971
66.972
+0.227
0.34%
jan 1, 1972
67.19
+0.218
0.33%
jan 1, 1973
67.405
+0.215
0.32%
jan 1, 1974
67.626
+0.221
0.33%
jan 1, 1975
67.857
+0.231
0.34%
jan 1, 1976
68.11
+0.253
0.37%
jan 1, 1977
68.394
+0.284
0.42%
jan 1, 1978
68.706
+0.312
0.46%
jan 1, 1979
69.041
+0.335
0.49%
jan 1, 1980
69.387
+0.346
0.5%
jan 1, 1981
69.726
+0.339
0.49%
jan 1, 1982
70.036
+0.31
0.44%
jan 1, 1983
70.301
+0.265
0.38%
jan 1, 1984
70.51
+0.209
0.3%
jan 1, 1985
70.66
+0.15
0.21%
jan 1, 1986
70.757
+0.097
0.14%
jan 1, 1987
70.814
+0.057
0.08%
jan 1, 1988
70.851
+0.037
0.05%
jan 1, 1989
70.886
+0.035
0.05%
jan 1, 1990
70.924
+0.038
0.05%
jan 1, 1991
70.969
+0.045
0.06%
jan 1, 1992
71.018
+0.049
0.07%
jan 1, 1993
71.062
+0.044
0.06%
jan 1, 1994
71.098
+0.036
0.05%
jan 1, 1995
71.126
+0.028
0.04%
jan 1, 1996
71.148
+0.022
0.03%
jan 1, 1997
71.167
+0.019
0.03%
jan 1, 1998
71.187
+0.02
0.03%
jan 1, 1999
71.214
+0.027
0.04%
jan 1, 2000
71.251
+0.037
0.05%
jan 1, 2001
71.305
+0.054
0.08%
jan 1, 2002
71.379
+0.074
0.1%
jan 1, 2003
71.475
+0.096
0.13%
jan 1, 2004
71.591
+0.116
0.16%
jan 1, 2005
71.725
+0.134
0.19%
jan 1, 2006
71.871
+0.146
0.2%
jan 1, 2007
72.024
+0.153
0.21%
jan 1, 2008
72.177
+0.153
0.21%
jan 1, 2009
72.325
+0.148
0.21%
jan 1, 2010
72.464
+0.139
0.19%
jan 1, 2011
72.595
+0.131
0.18%
jan 1, 2012
72.717
+0.122
0.17%
jan 1, 2013
72.836
+0.119
0.16%
jan 1, 2014
72.955
+0.119
0.16%
jan 1, 2015
73.075
+0.12
0.16%
Ranking of countries by current statistics by years


Comments: