29
/
en
AIzaSyAYiBZKx7MnpbEhh9jyipgxe19OcubqV5w
April 1, 2024
180103
Libya
LBY
true
2
1
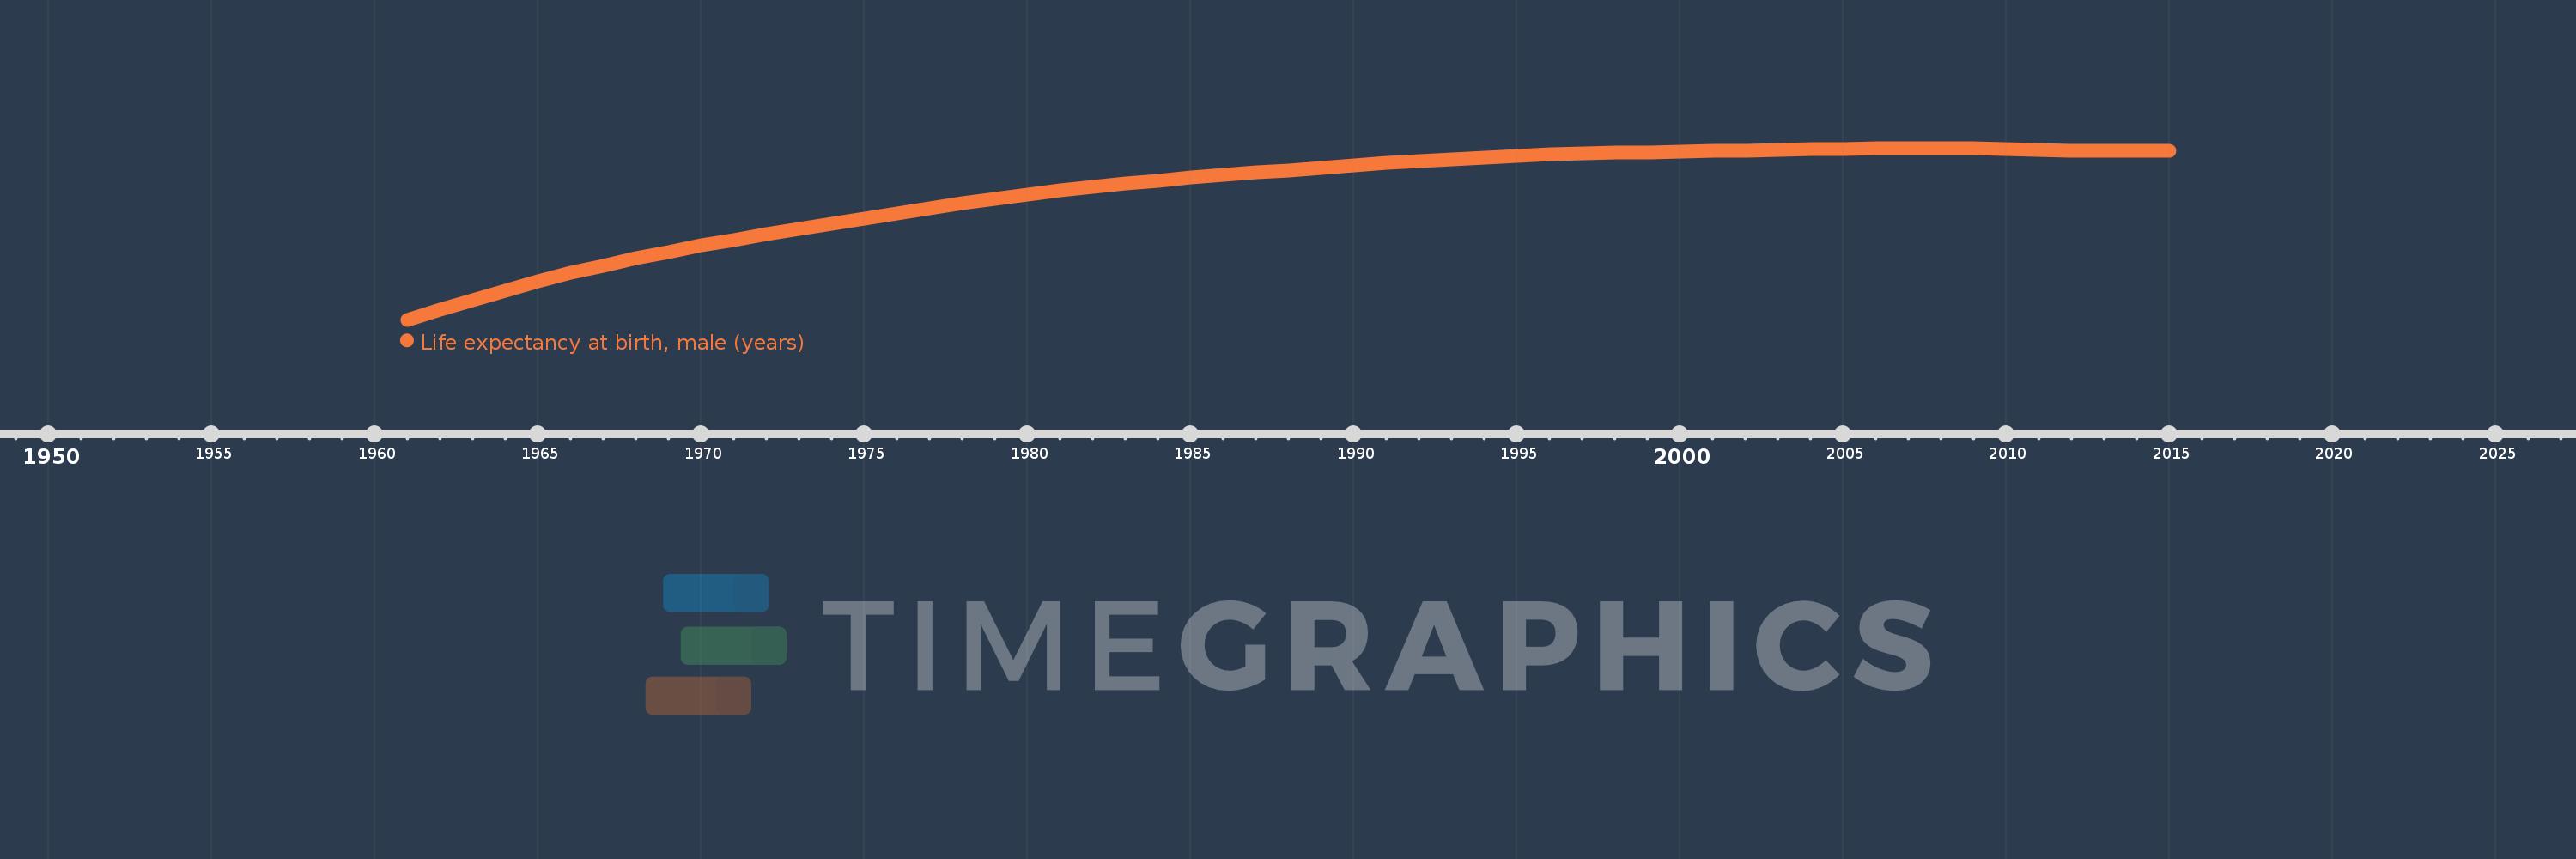
Life expectancy at birth, male (years)
2015,2014,2013,2012,2011,2010,2009,2008,2007,2006,2005,2004,2003,2002,2001,2000,1999,1998,1997,1996,1995,1994,1993,1992,1991,1990,1989,1988,1987,1986,1985,1984,1983,1982,1981,1980,1979,1978,1977,1976,1975,1974,1973,1972,1971,1970,1969,1968,1967,1966,1965,1964,1963,1962,1961
This statistics in other country:
AfghanistanAlbaniaAlgeriaAngolaAntigua and BarbudaArab WorldArgentinaArmeniaArubaAustraliaAustriaAzerbaijanBahamas, TheBahrainBangladeshBarbadosBelarusBelgiumBelizeBeninBermudaBhutanBoliviaBosnia and HerzegovinaBotswanaBrazilBrunei DarussalamBulgariaBurkina FasoBurundiCabo VerdeCambodiaCameroonCanadaCaribbean small statesCentral African RepublicCentral Europe and the BalticsChadChannel IslandsChileChinaColombiaComorosCongo, Dem. Rep.Congo, Rep.Costa RicaCote d'IvoireCroatiaCubaCuracaoCyprusCzech RepublicDenmarkDjiboutiDominicaDominican RepublicEarly-demographic dividendEast Asia & PacificEast Asia & Pacific (excluding high income)East Asia & Pacific (IDA & IBRD countries)EcuadorEgypt, Arab Rep.El SalvadorEquatorial GuineaEritreaEstoniaEthiopiaEuro areaEurope & Central AsiaEurope & Central Asia (excluding high income)Europe & Central Asia (IDA & IBRD countries)European UnionFaroe IslandsFijiFinlandFragile and conflict affected situationsFranceFrench PolynesiaGabonGambia, TheGeorgiaGermanyGhanaGreeceGreenlandGrenadaGuamGuatemalaGuineaGuinea-BissauGuyanaHaitiHeavily indebted poor countries (HIPC)High incomeHondurasHong Kong SAR, ChinaHungaryIBRD onlyIcelandIDA & IBRD totalIDA blendIDA onlyIDA totalIndiaIndonesiaIran, Islamic Rep.IraqIrelandIsle of ManIsraelItalyJamaicaJapanJordanKazakhstanKenyaKiribatiKorea, Dem. People’s Rep.Korea, Rep.KosovoKuwaitKyrgyz RepublicLao PDRLate-demographic dividendLatin America & Caribbean Latin America & Caribbean (excluding high income)Latin America & the Caribbean (IDA & IBRD countries)LatviaLeast developed countries: UN classificationLebanonLesothoLiberiaLibyaLiechtensteinLithuaniaLow & middle incomeLow incomeLower middle incomeLuxembourgMacao SAR, ChinaMacedonia, FYRMadagascarMalawiMalaysiaMaldivesMaliMaltaMarshall IslandsMauritaniaMauritiusMexicoMicronesia, Fed. Sts.Middle East & North AfricaMiddle East & North Africa (excluding high income)Middle East & North Africa (IDA & IBRD countries)Middle incomeMoldovaMongoliaMontenegroMoroccoMozambiqueMyanmarNamibiaNepalNetherlandsNew CaledoniaNew ZealandNicaraguaNigerNigeriaNorth AmericaNorwayOECD membersOmanOther small statesPacific island small statesPakistanPalauPanamaPapua New GuineaParaguayPeruPhilippinesPolandPortugalPost-demographic dividendPre-demographic dividendPuerto RicoQatarRomaniaRussian FederationRwandaSamoaSan MarinoSao Tome and PrincipeSaudi ArabiaSenegalSerbiaSeychellesSierra LeoneSingaporeSint Maarten (Dutch part)Slovak RepublicSloveniaSmall statesSolomon IslandsSomaliaSouth AfricaSouth AsiaSouth Asia (IDA & IBRD)South SudanSpainSri LankaSt. Kitts and NevisSt. LuciaSt. Martin (French part)St. Vincent and the GrenadinesSub-Saharan Africa Sub-Saharan Africa (excluding high income)Sub-Saharan Africa (IDA & IBRD countries)SudanSurinameSwazilandSwedenSwitzerlandSyrian Arab RepublicTajikistanTanzaniaThailandTimor-LesteTogoTongaTrinidad and TobagoTunisiaTurkeyTurkmenistanUgandaUkraineUnited Arab EmiratesUnited KingdomUnited StatesUpper middle incomeUruguayUzbekistanVanuatuVenezuela, RBVietnamVirgin Islands (U.S.)West Bank and GazaWorldYemen, Rep.ZambiaZimbabwe Timeline:
This timeline shows a graph from 1961 to 2015 of Libya. No data until 1960. Number of actual observations by date: 55.
Source name:
World Development Indicators
Source organization:
(1) United Nations Population Division. World Population Prospects, (2) Census reports and other statistical publications from national statistical offices, (3) Eurostat: Demographic Statistics, (4) United Nations Statistical Division. Population and Vital Statistics Reprot (various years), (5) U.S. Census Bureau: International Database, and (6) Secretariat of the Pacific Community: Statistics and Demography Programme.
Categories, topics:
Health, Gender, Social Development
Last updated:
apr 23, 2017
Indicators value changes by year
Minimum:
41.449
jan 1, 1961
Maximum:
69.433
jan 1, 2007
At the date of observation
Value
Absolute change
Change from previous value
jan 1, 1961
41.449
+41.449
0.0%
jan 1, 1962
43.034
+1.585
3.82%
jan 1, 1963
44.639
+1.605
3.73%
jan 1, 1964
46.205
+1.566
3.51%
jan 1, 1965
47.686
+1.481
3.21%
jan 1, 1966
49.051
+1.365
2.86%
jan 1, 1967
50.291
+1.24
2.53%
jan 1, 1968
51.437
+1.146
2.28%
jan 1, 1969
52.512
+1.075
2.09%
jan 1, 1970
53.524
+1.012
1.93%
jan 1, 1971
54.482
+0.958
1.79%
jan 1, 1972
55.397
+0.915
1.68%
jan 1, 1973
56.281
+0.884
1.6%
jan 1, 1974
57.142
+0.861
1.53%
jan 1, 1975
57.984
+0.842
1.47%
jan 1, 1976
58.808
+0.824
1.42%
jan 1, 1977
59.613
+0.805
1.37%
jan 1, 1978
60.389
+0.776
1.3%
jan 1, 1979
61.129
+0.74
1.23%
jan 1, 1980
61.828
+0.699
1.14%
jan 1, 1981
62.482
+0.654
1.06%
jan 1, 1982
63.083
+0.601
0.96%
jan 1, 1983
63.633
+0.55
0.87%
jan 1, 1984
64.135
+0.502
0.79%
jan 1, 1985
64.594
+0.459
0.72%
jan 1, 1986
65.02
+0.426
0.66%
jan 1, 1987
65.425
+0.405
0.62%
jan 1, 1988
65.82
+0.395
0.6%
jan 1, 1989
66.208
+0.388
0.59%
jan 1, 1990
66.592
+0.384
0.58%
jan 1, 1991
66.966
+0.374
0.56%
jan 1, 1992
67.318
+0.352
0.53%
jan 1, 1993
67.638
+0.32
0.48%
jan 1, 1994
67.917
+0.279
0.41%
jan 1, 1995
68.153
+0.236
0.35%
jan 1, 1996
68.347
+0.194
0.28%
jan 1, 1997
68.502
+0.155
0.23%
jan 1, 1998
68.628
+0.126
0.18%
jan 1, 1999
68.734
+0.106
0.15%
jan 1, 2000
68.826
+0.092
0.13%
jan 1, 2001
68.914
+0.088
0.13%
jan 1, 2002
69.008
+0.094
0.14%
jan 1, 2003
69.107
+0.099
0.14%
jan 1, 2004
69.208
+0.101
0.15%
jan 1, 2005
69.309
+0.101
0.15%
jan 1, 2006
69.391
+0.082
0.12%
jan 1, 2007
69.433
+0.042
0.06%
jan 1, 2008
69.424
-0.009
-0.01%
jan 1, 2009
69.363
-0.061
-0.09%
jan 1, 2010
69.259
-0.104
-0.15%
jan 1, 2011
69.133
-0.126
-0.18%
jan 1, 2012
69.014
-0.119
-0.17%
jan 1, 2013
68.932
-0.082
-0.12%
jan 1, 2014
68.905
-0.027
-0.04%
jan 1, 2015
68.941
+0.036
0.05%
Ranking of countries by current statistics by years


Comments: