29
/
en
AIzaSyAYiBZKx7MnpbEhh9jyipgxe19OcubqV5w
April 1, 2024
54941
Post-demographic dividend
PST
false
2
1
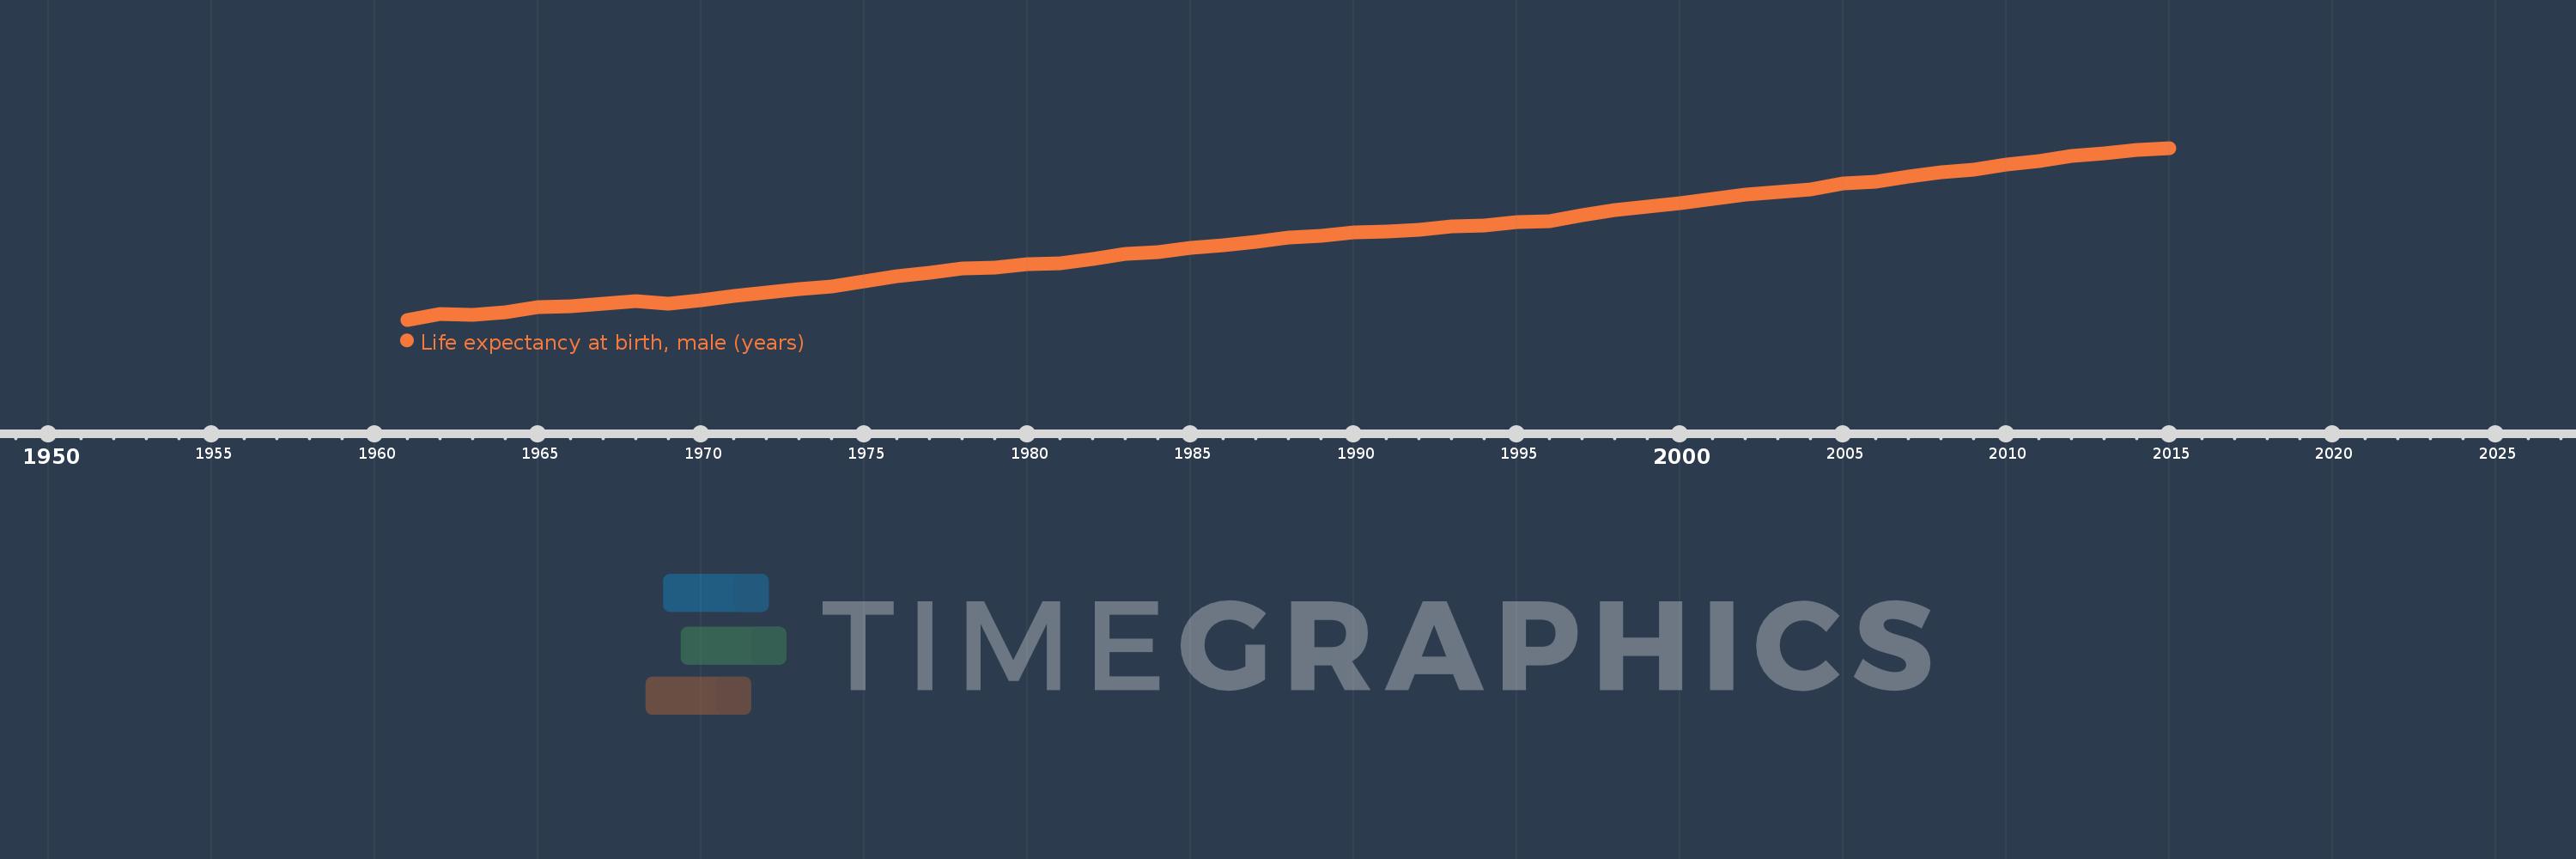
Life expectancy at birth, male (years)
2015,2014,2013,2012,2011,2010,2009,2008,2007,2006,2005,2004,2003,2002,2001,2000,1999,1998,1997,1996,1995,1994,1993,1992,1991,1990,1989,1988,1987,1986,1985,1984,1983,1982,1981,1980,1979,1978,1977,1976,1975,1974,1973,1972,1971,1970,1969,1968,1967,1966,1965,1964,1963,1962,1961
This statistics in other country:
AfghanistanAlbaniaAlgeriaAngolaAntigua and BarbudaArab WorldArgentinaArmeniaArubaAustraliaAustriaAzerbaijanBahamas, TheBahrainBangladeshBarbadosBelarusBelgiumBelizeBeninBermudaBhutanBoliviaBosnia and HerzegovinaBotswanaBrazilBrunei DarussalamBulgariaBurkina FasoBurundiCabo VerdeCambodiaCameroonCanadaCaribbean small statesCentral African RepublicCentral Europe and the BalticsChadChannel IslandsChileChinaColombiaComorosCongo, Dem. Rep.Congo, Rep.Costa RicaCote d'IvoireCroatiaCubaCuracaoCyprusCzech RepublicDenmarkDjiboutiDominicaDominican RepublicEarly-demographic dividendEast Asia & PacificEast Asia & Pacific (excluding high income)East Asia & Pacific (IDA & IBRD countries)EcuadorEgypt, Arab Rep.El SalvadorEquatorial GuineaEritreaEstoniaEthiopiaEuro areaEurope & Central AsiaEurope & Central Asia (excluding high income)Europe & Central Asia (IDA & IBRD countries)European UnionFaroe IslandsFijiFinlandFragile and conflict affected situationsFranceFrench PolynesiaGabonGambia, TheGeorgiaGermanyGhanaGreeceGreenlandGrenadaGuamGuatemalaGuineaGuinea-BissauGuyanaHaitiHeavily indebted poor countries (HIPC)High incomeHondurasHong Kong SAR, ChinaHungaryIBRD onlyIcelandIDA & IBRD totalIDA blendIDA onlyIDA totalIndiaIndonesiaIran, Islamic Rep.IraqIrelandIsle of ManIsraelItalyJamaicaJapanJordanKazakhstanKenyaKiribatiKorea, Dem. People’s Rep.Korea, Rep.KosovoKuwaitKyrgyz RepublicLao PDRLate-demographic dividendLatin America & Caribbean Latin America & Caribbean (excluding high income)Latin America & the Caribbean (IDA & IBRD countries)LatviaLeast developed countries: UN classificationLebanonLesothoLiberiaLibyaLiechtensteinLithuaniaLow & middle incomeLow incomeLower middle incomeLuxembourgMacao SAR, ChinaMacedonia, FYRMadagascarMalawiMalaysiaMaldivesMaliMaltaMarshall IslandsMauritaniaMauritiusMexicoMicronesia, Fed. Sts.Middle East & North AfricaMiddle East & North Africa (excluding high income)Middle East & North Africa (IDA & IBRD countries)Middle incomeMoldovaMongoliaMontenegroMoroccoMozambiqueMyanmarNamibiaNepalNetherlandsNew CaledoniaNew ZealandNicaraguaNigerNigeriaNorth AmericaNorwayOECD membersOmanOther small statesPacific island small statesPakistanPalauPanamaPapua New GuineaParaguayPeruPhilippinesPolandPortugalPost-demographic dividendPre-demographic dividendPuerto RicoQatarRomaniaRussian FederationRwandaSamoaSan MarinoSao Tome and PrincipeSaudi ArabiaSenegalSerbiaSeychellesSierra LeoneSingaporeSint Maarten (Dutch part)Slovak RepublicSloveniaSmall statesSolomon IslandsSomaliaSouth AfricaSouth AsiaSouth Asia (IDA & IBRD)South SudanSpainSri LankaSt. Kitts and NevisSt. LuciaSt. Martin (French part)St. Vincent and the GrenadinesSub-Saharan Africa Sub-Saharan Africa (excluding high income)Sub-Saharan Africa (IDA & IBRD countries)SudanSurinameSwazilandSwedenSwitzerlandSyrian Arab RepublicTajikistanTanzaniaThailandTimor-LesteTogoTongaTrinidad and TobagoTunisiaTurkeyTurkmenistanUgandaUkraineUnited Arab EmiratesUnited KingdomUnited StatesUpper middle incomeUruguayUzbekistanVanuatuVenezuela, RBVietnamVirgin Islands (U.S.)West Bank and GazaWorldYemen, Rep.ZambiaZimbabwe Timeline:
This timeline shows a graph from 1961 to 2015 of Post-demographic dividend. No data until 1960. Number of actual observations by date: 55.
Source name:
World Development Indicators
Source organization:
(1) United Nations Population Division. World Population Prospects, (2) Census reports and other statistical publications from national statistical offices, (3) Eurostat: Demographic Statistics, (4) United Nations Statistical Division. Population and Vital Statistics Reprot (various years), (5) U.S. Census Bureau: International Database, and (6) Secretariat of the Pacific Community: Statistics and Demography Programme.
Categories, topics:
Health, Gender, Social Development
Last updated:
apr 23, 2017
Indicators value changes by year
Minimum:
65.995
jan 1, 1961
Maximum:
77.873
jan 1, 2015
At the date of observation
Value
Absolute change
Change from previous value
jan 1, 1961
65.995
+65.995
0.0%
jan 1, 1962
66.369
+0.373
0.57%
jan 1, 1963
66.335
-0.034
-0.05%
jan 1, 1964
66.485
+0.15
0.23%
jan 1, 1965
66.842
+0.357
0.54%
jan 1, 1966
66.901
+0.059
0.09%
jan 1, 1967
67.099
+0.197
0.29%
jan 1, 1968
67.305
+0.206
0.31%
jan 1, 1969
67.11
-0.195
-0.29%
jan 1, 1970
67.318
+0.208
0.31%
jan 1, 1971
67.635
+0.317
0.47%
jan 1, 1972
67.885
+0.25
0.37%
jan 1, 1973
68.119
+0.234
0.34%
jan 1, 1974
68.287
+0.168
0.25%
jan 1, 1975
68.676
+0.389
0.57%
jan 1, 1976
69.004
+0.328
0.48%
jan 1, 1977
69.236
+0.232
0.34%
jan 1, 1978
69.527
+0.291
0.42%
jan 1, 1979
69.629
+0.102
0.15%
jan 1, 1980
69.864
+0.235
0.34%
jan 1, 1981
69.909
+0.045
0.06%
jan 1, 1982
70.214
+0.305
0.44%
jan 1, 1983
70.548
+0.335
0.48%
jan 1, 1984
70.676
+0.128
0.18%
jan 1, 1985
70.959
+0.283
0.4%
jan 1, 1986
71.115
+0.156
0.22%
jan 1, 1987
71.387
+0.272
0.38%
jan 1, 1988
71.685
+0.298
0.42%
jan 1, 1989
71.791
+0.105
0.15%
jan 1, 1990
72.029
+0.238
0.33%
jan 1, 1991
72.116
+0.087
0.12%
jan 1, 1992
72.207
+0.091
0.13%
jan 1, 1993
72.448
+0.241
0.33%
jan 1, 1994
72.493
+0.045
0.06%
jan 1, 1995
72.736
+0.244
0.34%
jan 1, 1996
72.783
+0.046
0.06%
jan 1, 1997
73.196
+0.413
0.57%
jan 1, 1998
73.58
+0.384
0.52%
jan 1, 1999
73.831
+0.251
0.34%
jan 1, 2000
74.055
+0.224
0.3%
jan 1, 2001
74.334
+0.279
0.38%
jan 1, 2002
74.669
+0.335
0.45%
jan 1, 2003
74.808
+0.139
0.19%
jan 1, 2004
74.978
+0.17
0.23%
jan 1, 2005
75.436
+0.458
0.61%
jan 1, 2006
75.547
+0.111
0.15%
jan 1, 2007
75.892
+0.345
0.46%
jan 1, 2008
76.167
+0.275
0.36%
jan 1, 2009
76.361
+0.194
0.25%
jan 1, 2010
76.719
+0.358
0.47%
jan 1, 2011
76.983
+0.264
0.34%
jan 1, 2012
77.298
+0.315
0.41%
jan 1, 2013
77.482
+0.184
0.24%
jan 1, 2014
77.727
+0.244
0.32%
jan 1, 2015
77.873
+0.146
0.19%
Ranking of countries by current statistics by years


Comments: