29
/
en
AIzaSyAYiBZKx7MnpbEhh9jyipgxe19OcubqV5w
April 1, 2024
284851
Yemen, Rep.
YEM
true
2
1
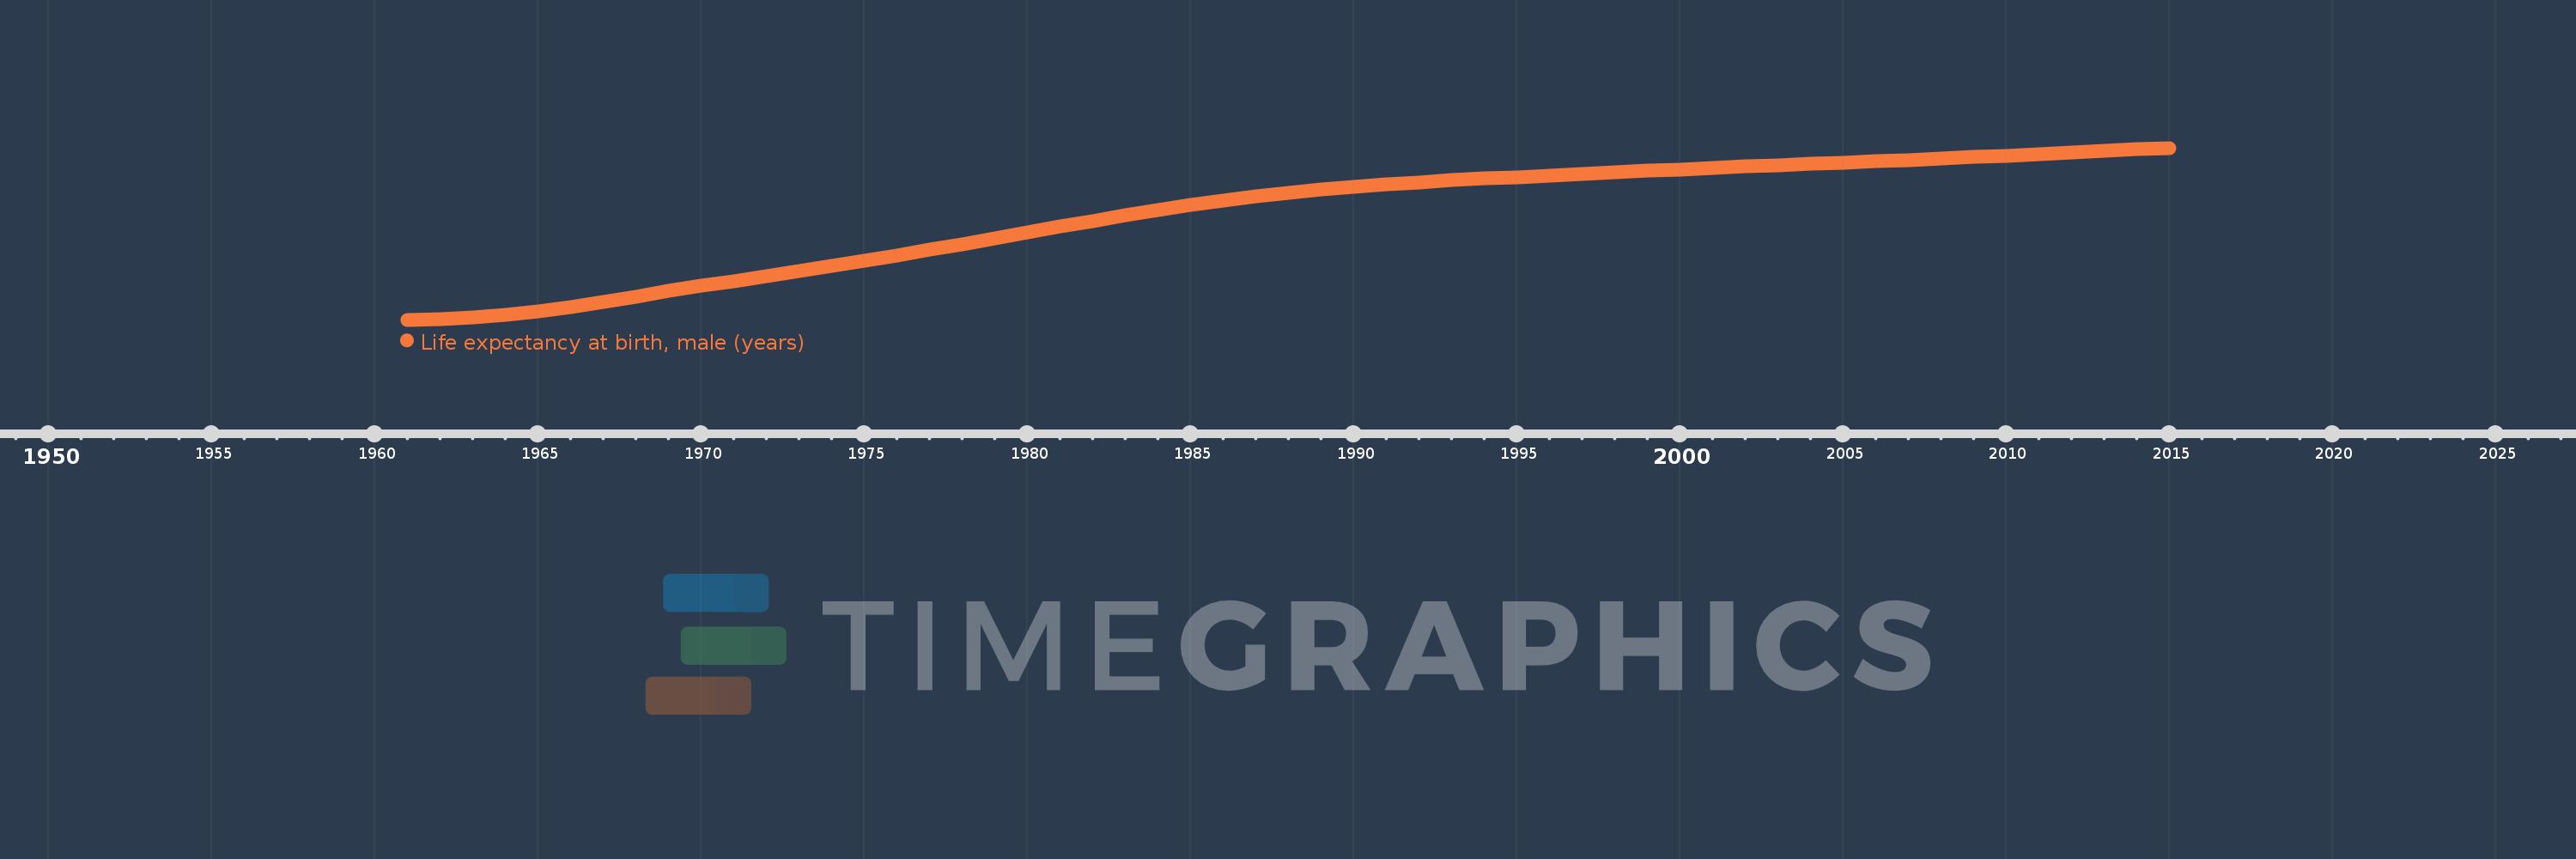
Life expectancy at birth, male (years)
2015,2014,2013,2012,2011,2010,2009,2008,2007,2006,2005,2004,2003,2002,2001,2000,1999,1998,1997,1996,1995,1994,1993,1992,1991,1990,1989,1988,1987,1986,1985,1984,1983,1982,1981,1980,1979,1978,1977,1976,1975,1974,1973,1972,1971,1970,1969,1968,1967,1966,1965,1964,1963,1962,1961
This statistics in other country:
AfghanistanAlbaniaAlgeriaAngolaAntigua and BarbudaArab WorldArgentinaArmeniaArubaAustraliaAustriaAzerbaijanBahamas, TheBahrainBangladeshBarbadosBelarusBelgiumBelizeBeninBermudaBhutanBoliviaBosnia and HerzegovinaBotswanaBrazilBrunei DarussalamBulgariaBurkina FasoBurundiCabo VerdeCambodiaCameroonCanadaCaribbean small statesCentral African RepublicCentral Europe and the BalticsChadChannel IslandsChileChinaColombiaComorosCongo, Dem. Rep.Congo, Rep.Costa RicaCote d'IvoireCroatiaCubaCuracaoCyprusCzech RepublicDenmarkDjiboutiDominicaDominican RepublicEarly-demographic dividendEast Asia & PacificEast Asia & Pacific (excluding high income)East Asia & Pacific (IDA & IBRD countries)EcuadorEgypt, Arab Rep.El SalvadorEquatorial GuineaEritreaEstoniaEthiopiaEuro areaEurope & Central AsiaEurope & Central Asia (excluding high income)Europe & Central Asia (IDA & IBRD countries)European UnionFaroe IslandsFijiFinlandFragile and conflict affected situationsFranceFrench PolynesiaGabonGambia, TheGeorgiaGermanyGhanaGreeceGreenlandGrenadaGuamGuatemalaGuineaGuinea-BissauGuyanaHaitiHeavily indebted poor countries (HIPC)High incomeHondurasHong Kong SAR, ChinaHungaryIBRD onlyIcelandIDA & IBRD totalIDA blendIDA onlyIDA totalIndiaIndonesiaIran, Islamic Rep.IraqIrelandIsle of ManIsraelItalyJamaicaJapanJordanKazakhstanKenyaKiribatiKorea, Dem. People’s Rep.Korea, Rep.KosovoKuwaitKyrgyz RepublicLao PDRLate-demographic dividendLatin America & Caribbean Latin America & Caribbean (excluding high income)Latin America & the Caribbean (IDA & IBRD countries)LatviaLeast developed countries: UN classificationLebanonLesothoLiberiaLibyaLiechtensteinLithuaniaLow & middle incomeLow incomeLower middle incomeLuxembourgMacao SAR, ChinaMacedonia, FYRMadagascarMalawiMalaysiaMaldivesMaliMaltaMarshall IslandsMauritaniaMauritiusMexicoMicronesia, Fed. Sts.Middle East & North AfricaMiddle East & North Africa (excluding high income)Middle East & North Africa (IDA & IBRD countries)Middle incomeMoldovaMongoliaMontenegroMoroccoMozambiqueMyanmarNamibiaNepalNetherlandsNew CaledoniaNew ZealandNicaraguaNigerNigeriaNorth AmericaNorwayOECD membersOmanOther small statesPacific island small statesPakistanPalauPanamaPapua New GuineaParaguayPeruPhilippinesPolandPortugalPost-demographic dividendPre-demographic dividendPuerto RicoQatarRomaniaRussian FederationRwandaSamoaSan MarinoSao Tome and PrincipeSaudi ArabiaSenegalSerbiaSeychellesSierra LeoneSingaporeSint Maarten (Dutch part)Slovak RepublicSloveniaSmall statesSolomon IslandsSomaliaSouth AfricaSouth AsiaSouth Asia (IDA & IBRD)South SudanSpainSri LankaSt. Kitts and NevisSt. LuciaSt. Martin (French part)St. Vincent and the GrenadinesSub-Saharan Africa Sub-Saharan Africa (excluding high income)Sub-Saharan Africa (IDA & IBRD countries)SudanSurinameSwazilandSwedenSwitzerlandSyrian Arab RepublicTajikistanTanzaniaThailandTimor-LesteTogoTongaTrinidad and TobagoTunisiaTurkeyTurkmenistanUgandaUkraineUnited Arab EmiratesUnited KingdomUnited StatesUpper middle incomeUruguayUzbekistanVanuatuVenezuela, RBVietnamVirgin Islands (U.S.)West Bank and GazaWorldYemen, Rep.ZambiaZimbabwe Timeline:
This timeline shows a graph from 1961 to 2015 of Yemen, Rep.. No data until 1960. Number of actual observations by date: 55.
Source name:
World Development Indicators
Source organization:
(1) United Nations Population Division. World Population Prospects, (2) Census reports and other statistical publications from national statistical offices, (3) Eurostat: Demographic Statistics, (4) United Nations Statistical Division. Population and Vital Statistics Reprot (various years), (5) U.S. Census Bureau: International Database, and (6) Secretariat of the Pacific Community: Statistics and Demography Programme.
Categories, topics:
Health, Gender, Social Development
Last updated:
apr 23, 2017
Indicators value changes by year
Minimum:
33.236
jan 1, 1961
Maximum:
62.486
jan 1, 2015
At the date of observation
Value
Absolute change
Change from previous value
jan 1, 1961
33.236
+33.236
0.0%
jan 1, 1962
33.343
+0.107
0.32%
jan 1, 1963
33.602
+0.259
0.78%
jan 1, 1964
34.038
+0.436
1.3%
jan 1, 1965
34.648
+0.61
1.79%
jan 1, 1966
35.409
+0.761
2.2%
jan 1, 1967
36.275
+0.866
2.45%
jan 1, 1968
37.188
+0.913
2.52%
jan 1, 1969
38.1
+0.912
2.45%
jan 1, 1970
38.988
+0.888
2.33%
jan 1, 1971
39.843
+0.855
2.19%
jan 1, 1972
40.673
+0.83
2.08%
jan 1, 1973
41.508
+0.835
2.05%
jan 1, 1974
42.366
+0.858
2.07%
jan 1, 1975
43.251
+0.885
2.09%
jan 1, 1976
44.169
+0.918
2.12%
jan 1, 1977
45.12
+0.951
2.15%
jan 1, 1978
46.099
+0.979
2.17%
jan 1, 1979
47.093
+0.994
2.16%
jan 1, 1980
48.09
+0.997
2.12%
jan 1, 1981
49.081
+0.991
2.06%
jan 1, 1982
50.055
+0.974
1.98%
jan 1, 1983
51.001
+0.946
1.89%
jan 1, 1984
51.907
+0.906
1.78%
jan 1, 1985
52.759
+0.852
1.64%
jan 1, 1986
53.542
+0.783
1.48%
jan 1, 1987
54.244
+0.702
1.31%
jan 1, 1988
54.866
+0.622
1.15%
jan 1, 1989
55.41
+0.544
0.99%
jan 1, 1990
55.883
+0.473
0.85%
jan 1, 1991
56.292
+0.409
0.73%
jan 1, 1992
56.647
+0.355
0.63%
jan 1, 1993
56.964
+0.317
0.56%
jan 1, 1994
57.258
+0.294
0.52%
jan 1, 1995
57.538
+0.28
0.49%
jan 1, 1996
57.813
+0.275
0.48%
jan 1, 1997
58.084
+0.271
0.47%
jan 1, 1998
58.347
+0.263
0.45%
jan 1, 1999
58.602
+0.255
0.44%
jan 1, 2000
58.85
+0.248
0.42%
jan 1, 2001
59.091
+0.241
0.41%
jan 1, 2002
59.324
+0.233
0.39%
jan 1, 2003
59.548
+0.224
0.38%
jan 1, 2004
59.765
+0.217
0.36%
jan 1, 2005
59.979
+0.214
0.36%
jan 1, 2006
60.195
+0.216
0.36%
jan 1, 2007
60.424
+0.229
0.38%
jan 1, 2008
60.667
+0.243
0.4%
jan 1, 2009
60.926
+0.259
0.43%
jan 1, 2010
61.199
+0.273
0.45%
jan 1, 2011
61.478
+0.279
0.46%
jan 1, 2012
61.755
+0.277
0.45%
jan 1, 2013
62.019
+0.264
0.43%
jan 1, 2014
62.264
+0.245
0.4%
jan 1, 2015
62.486
+0.222
0.36%
Ranking of countries by current statistics by years


Comments: