29
/
en
AIzaSyAYiBZKx7MnpbEhh9jyipgxe19OcubqV5w
April 1, 2024
253242
Sudan
SDN
true
2
1
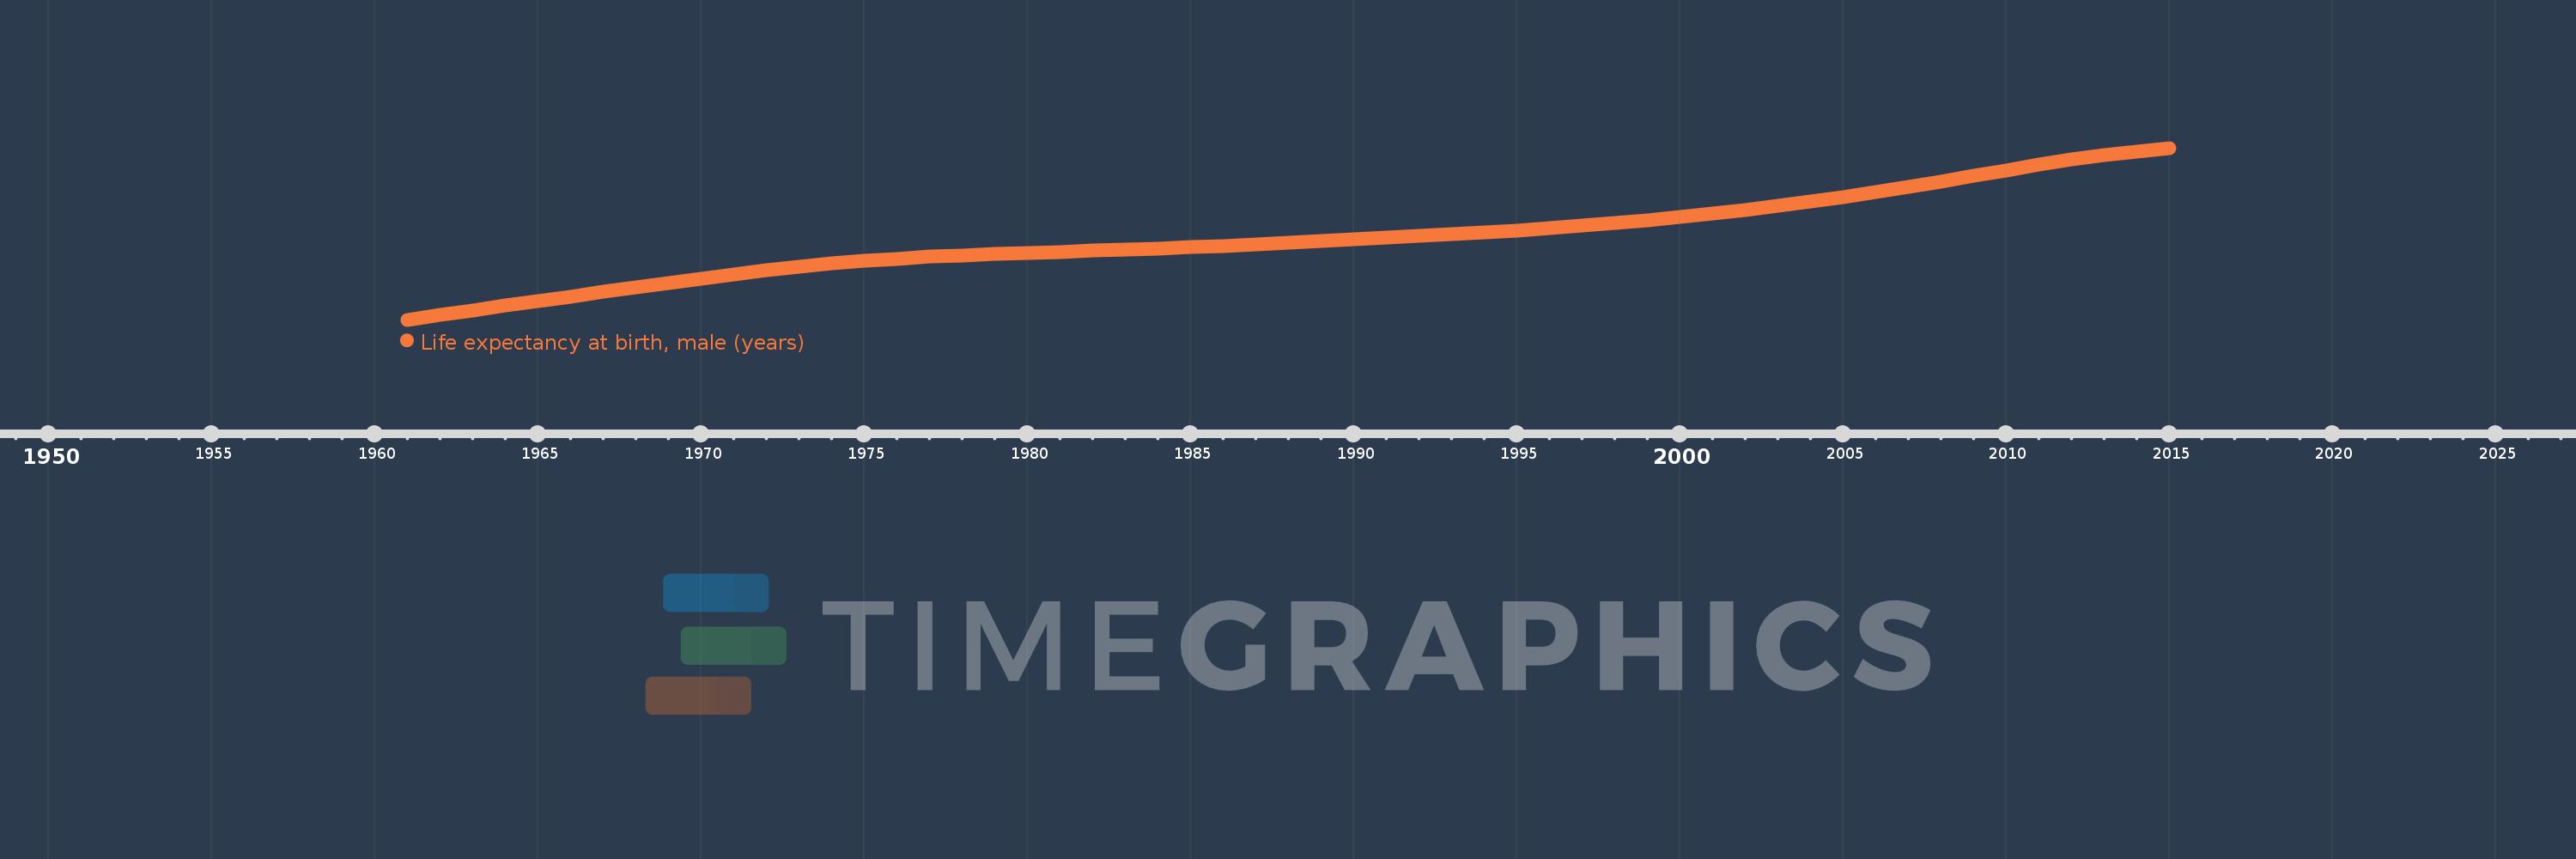
Life expectancy at birth, male (years)
2015,2014,2013,2012,2011,2010,2009,2008,2007,2006,2005,2004,2003,2002,2001,2000,1999,1998,1997,1996,1995,1994,1993,1992,1991,1990,1989,1988,1987,1986,1985,1984,1983,1982,1981,1980,1979,1978,1977,1976,1975,1974,1973,1972,1971,1970,1969,1968,1967,1966,1965,1964,1963,1962,1961
This statistics in other country:
AfghanistanAlbaniaAlgeriaAngolaAntigua and BarbudaArab WorldArgentinaArmeniaArubaAustraliaAustriaAzerbaijanBahamas, TheBahrainBangladeshBarbadosBelarusBelgiumBelizeBeninBermudaBhutanBoliviaBosnia and HerzegovinaBotswanaBrazilBrunei DarussalamBulgariaBurkina FasoBurundiCabo VerdeCambodiaCameroonCanadaCaribbean small statesCentral African RepublicCentral Europe and the BalticsChadChannel IslandsChileChinaColombiaComorosCongo, Dem. Rep.Congo, Rep.Costa RicaCote d'IvoireCroatiaCubaCuracaoCyprusCzech RepublicDenmarkDjiboutiDominicaDominican RepublicEarly-demographic dividendEast Asia & PacificEast Asia & Pacific (excluding high income)East Asia & Pacific (IDA & IBRD countries)EcuadorEgypt, Arab Rep.El SalvadorEquatorial GuineaEritreaEstoniaEthiopiaEuro areaEurope & Central AsiaEurope & Central Asia (excluding high income)Europe & Central Asia (IDA & IBRD countries)European UnionFaroe IslandsFijiFinlandFragile and conflict affected situationsFranceFrench PolynesiaGabonGambia, TheGeorgiaGermanyGhanaGreeceGreenlandGrenadaGuamGuatemalaGuineaGuinea-BissauGuyanaHaitiHeavily indebted poor countries (HIPC)High incomeHondurasHong Kong SAR, ChinaHungaryIBRD onlyIcelandIDA & IBRD totalIDA blendIDA onlyIDA totalIndiaIndonesiaIran, Islamic Rep.IraqIrelandIsle of ManIsraelItalyJamaicaJapanJordanKazakhstanKenyaKiribatiKorea, Dem. People’s Rep.Korea, Rep.KosovoKuwaitKyrgyz RepublicLao PDRLate-demographic dividendLatin America & Caribbean Latin America & Caribbean (excluding high income)Latin America & the Caribbean (IDA & IBRD countries)LatviaLeast developed countries: UN classificationLebanonLesothoLiberiaLibyaLiechtensteinLithuaniaLow & middle incomeLow incomeLower middle incomeLuxembourgMacao SAR, ChinaMacedonia, FYRMadagascarMalawiMalaysiaMaldivesMaliMaltaMarshall IslandsMauritaniaMauritiusMexicoMicronesia, Fed. Sts.Middle East & North AfricaMiddle East & North Africa (excluding high income)Middle East & North Africa (IDA & IBRD countries)Middle incomeMoldovaMongoliaMontenegroMoroccoMozambiqueMyanmarNamibiaNepalNetherlandsNew CaledoniaNew ZealandNicaraguaNigerNigeriaNorth AmericaNorwayOECD membersOmanOther small statesPacific island small statesPakistanPalauPanamaPapua New GuineaParaguayPeruPhilippinesPolandPortugalPost-demographic dividendPre-demographic dividendPuerto RicoQatarRomaniaRussian FederationRwandaSamoaSan MarinoSao Tome and PrincipeSaudi ArabiaSenegalSerbiaSeychellesSierra LeoneSingaporeSint Maarten (Dutch part)Slovak RepublicSloveniaSmall statesSolomon IslandsSomaliaSouth AfricaSouth AsiaSouth Asia (IDA & IBRD)South SudanSpainSri LankaSt. Kitts and NevisSt. LuciaSt. Martin (French part)St. Vincent and the GrenadinesSub-Saharan Africa Sub-Saharan Africa (excluding high income)Sub-Saharan Africa (IDA & IBRD countries)SudanSurinameSwazilandSwedenSwitzerlandSyrian Arab RepublicTajikistanTanzaniaThailandTimor-LesteTogoTongaTrinidad and TobagoTunisiaTurkeyTurkmenistanUgandaUkraineUnited Arab EmiratesUnited KingdomUnited StatesUpper middle incomeUruguayUzbekistanVanuatuVenezuela, RBVietnamVirgin Islands (U.S.)West Bank and GazaWorldYemen, Rep.ZambiaZimbabwe Timeline:
This timeline shows a graph from 1961 to 2015 of Sudan. No data until 1960. Number of actual observations by date: 55.
Source name:
World Development Indicators
Source organization:
(1) United Nations Population Division. World Population Prospects, (2) Census reports and other statistical publications from national statistical offices, (3) Eurostat: Demographic Statistics, (4) United Nations Statistical Division. Population and Vital Statistics Reprot (various years), (5) U.S. Census Bureau: International Database, and (6) Secretariat of the Pacific Community: Statistics and Demography Programme.
Categories, topics:
Health, Gender, Social Development
Last updated:
apr 23, 2017
Indicators value changes by year
Minimum:
46.793
jan 1, 1961
At the date of observation
Value
Absolute change
Change from previous value
jan 1, 1961
46.793
+46.793
0.0%
jan 1, 1962
47.213
+0.42
0.9%
jan 1, 1963
47.626
+0.413
0.87%
jan 1, 1964
48.035
+0.409
0.86%
jan 1, 1965
48.439
+0.404
0.84%
jan 1, 1966
48.843
+0.404
0.83%
jan 1, 1967
49.248
+0.405
0.83%
jan 1, 1968
49.652
+0.404
0.82%
jan 1, 1969
50.051
+0.399
0.8%
jan 1, 1970
50.44
+0.389
0.78%
jan 1, 1971
50.81
+0.37
0.73%
jan 1, 1972
51.156
+0.346
0.68%
jan 1, 1973
51.469
+0.313
0.61%
jan 1, 1974
51.748
+0.279
0.54%
jan 1, 1975
51.989
+0.241
0.47%
jan 1, 1976
52.193
+0.204
0.39%
jan 1, 1977
52.36
+0.167
0.32%
jan 1, 1978
52.496
+0.136
0.26%
jan 1, 1979
52.612
+0.116
0.22%
jan 1, 1980
52.712
+0.1
0.19%
jan 1, 1981
52.806
+0.094
0.18%
jan 1, 1982
52.899
+0.093
0.18%
jan 1, 1983
52.996
+0.097
0.18%
jan 1, 1984
53.099
+0.103
0.19%
jan 1, 1985
53.213
+0.114
0.21%
jan 1, 1986
53.338
+0.125
0.23%
jan 1, 1987
53.473
+0.135
0.25%
jan 1, 1988
53.614
+0.141
0.26%
jan 1, 1989
53.757
+0.143
0.27%
jan 1, 1990
53.903
+0.146
0.27%
jan 1, 1991
54.053
+0.15
0.28%
jan 1, 1992
54.205
+0.152
0.28%
jan 1, 1993
54.363
+0.158
0.29%
jan 1, 1994
54.528
+0.165
0.3%
jan 1, 1995
54.705
+0.177
0.32%
jan 1, 1996
54.896
+0.191
0.35%
jan 1, 1997
55.104
+0.208
0.38%
jan 1, 1998
55.331
+0.227
0.41%
jan 1, 1999
55.58
+0.249
0.45%
jan 1, 2000
55.854
+0.274
0.49%
jan 1, 2001
56.154
+0.3
0.54%
jan 1, 2002
56.482
+0.328
0.58%
jan 1, 2003
56.838
+0.356
0.63%
jan 1, 2004
57.22
+0.382
0.67%
jan 1, 2005
57.624
+0.404
0.71%
jan 1, 2006
58.054
+0.43
0.75%
jan 1, 2007
58.512
+0.458
0.79%
jan 1, 2008
58.996
+0.484
0.83%
jan 1, 2009
59.495
+0.499
0.85%
jan 1, 2010
59.998
+0.503
0.85%
jan 1, 2011
60.486
+0.488
0.81%
jan 1, 2012
60.937
+0.451
0.75%
jan 1, 2013
61.34
+0.403
0.66%
jan 1, 2014
61.689
+0.349
0.57%
jan 1, 2015
61.98
+0.291
0.47%
Ranking of countries by current statistics by years


Comments: