29
/
en
AIzaSyAYiBZKx7MnpbEhh9jyipgxe19OcubqV5w
April 1, 2024
70048
Argentina
ARG
true
2
1
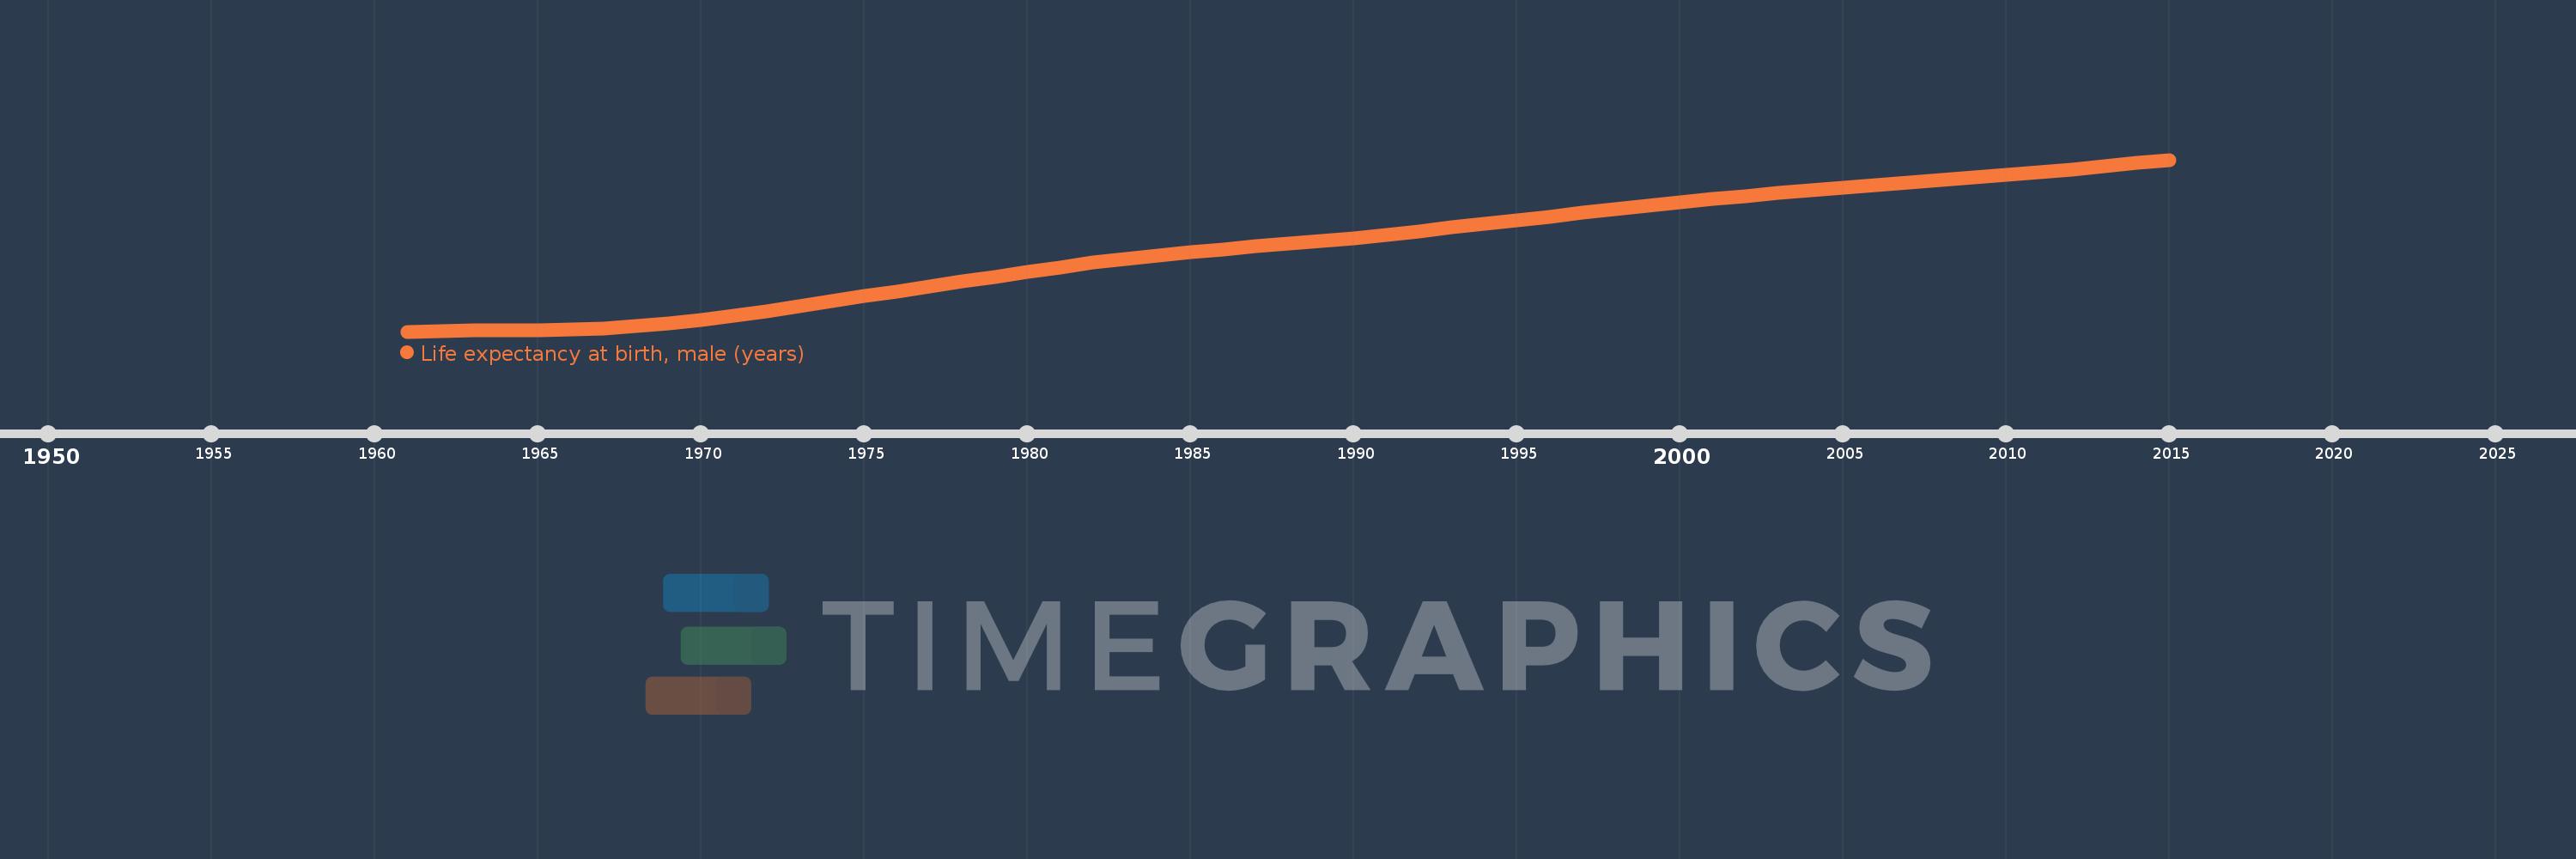
Life expectancy at birth, male (years)
2015,2014,2013,2012,2011,2010,2009,2008,2007,2006,2005,2004,2003,2002,2001,2000,1999,1998,1997,1996,1995,1994,1993,1992,1991,1990,1989,1988,1987,1986,1985,1984,1983,1982,1981,1980,1979,1978,1977,1976,1975,1974,1973,1972,1971,1970,1969,1968,1967,1966,1965,1964,1963,1962,1961
This statistics in other country:
AfghanistanAlbaniaAlgeriaAngolaAntigua and BarbudaArab WorldArgentinaArmeniaArubaAustraliaAustriaAzerbaijanBahamas, TheBahrainBangladeshBarbadosBelarusBelgiumBelizeBeninBermudaBhutanBoliviaBosnia and HerzegovinaBotswanaBrazilBrunei DarussalamBulgariaBurkina FasoBurundiCabo VerdeCambodiaCameroonCanadaCaribbean small statesCentral African RepublicCentral Europe and the BalticsChadChannel IslandsChileChinaColombiaComorosCongo, Dem. Rep.Congo, Rep.Costa RicaCote d'IvoireCroatiaCubaCuracaoCyprusCzech RepublicDenmarkDjiboutiDominicaDominican RepublicEarly-demographic dividendEast Asia & PacificEast Asia & Pacific (excluding high income)East Asia & Pacific (IDA & IBRD countries)EcuadorEgypt, Arab Rep.El SalvadorEquatorial GuineaEritreaEstoniaEthiopiaEuro areaEurope & Central AsiaEurope & Central Asia (excluding high income)Europe & Central Asia (IDA & IBRD countries)European UnionFaroe IslandsFijiFinlandFragile and conflict affected situationsFranceFrench PolynesiaGabonGambia, TheGeorgiaGermanyGhanaGreeceGreenlandGrenadaGuamGuatemalaGuineaGuinea-BissauGuyanaHaitiHeavily indebted poor countries (HIPC)High incomeHondurasHong Kong SAR, ChinaHungaryIBRD onlyIcelandIDA & IBRD totalIDA blendIDA onlyIDA totalIndiaIndonesiaIran, Islamic Rep.IraqIrelandIsle of ManIsraelItalyJamaicaJapanJordanKazakhstanKenyaKiribatiKorea, Dem. People’s Rep.Korea, Rep.KosovoKuwaitKyrgyz RepublicLao PDRLate-demographic dividendLatin America & Caribbean Latin America & Caribbean (excluding high income)Latin America & the Caribbean (IDA & IBRD countries)LatviaLeast developed countries: UN classificationLebanonLesothoLiberiaLibyaLiechtensteinLithuaniaLow & middle incomeLow incomeLower middle incomeLuxembourgMacao SAR, ChinaMacedonia, FYRMadagascarMalawiMalaysiaMaldivesMaliMaltaMarshall IslandsMauritaniaMauritiusMexicoMicronesia, Fed. Sts.Middle East & North AfricaMiddle East & North Africa (excluding high income)Middle East & North Africa (IDA & IBRD countries)Middle incomeMoldovaMongoliaMontenegroMoroccoMozambiqueMyanmarNamibiaNepalNetherlandsNew CaledoniaNew ZealandNicaraguaNigerNigeriaNorth AmericaNorwayOECD membersOmanOther small statesPacific island small statesPakistanPalauPanamaPapua New GuineaParaguayPeruPhilippinesPolandPortugalPost-demographic dividendPre-demographic dividendPuerto RicoQatarRomaniaRussian FederationRwandaSamoaSan MarinoSao Tome and PrincipeSaudi ArabiaSenegalSerbiaSeychellesSierra LeoneSingaporeSint Maarten (Dutch part)Slovak RepublicSloveniaSmall statesSolomon IslandsSomaliaSouth AfricaSouth AsiaSouth Asia (IDA & IBRD)South SudanSpainSri LankaSt. Kitts and NevisSt. LuciaSt. Martin (French part)St. Vincent and the GrenadinesSub-Saharan Africa Sub-Saharan Africa (excluding high income)Sub-Saharan Africa (IDA & IBRD countries)SudanSurinameSwazilandSwedenSwitzerlandSyrian Arab RepublicTajikistanTanzaniaThailandTimor-LesteTogoTongaTrinidad and TobagoTunisiaTurkeyTurkmenistanUgandaUkraineUnited Arab EmiratesUnited KingdomUnited StatesUpper middle incomeUruguayUzbekistanVanuatuVenezuela, RBVietnamVirgin Islands (U.S.)West Bank and GazaWorldYemen, Rep.ZambiaZimbabwe Timeline:
This timeline shows a graph from 1961 to 2015 of Argentina. No data until 1960. Number of actual observations by date: 55.
Source name:
World Development Indicators
Source organization:
(1) United Nations Population Division. World Population Prospects, (2) Census reports and other statistical publications from national statistical offices, (3) Eurostat: Demographic Statistics, (4) United Nations Statistical Division. Population and Vital Statistics Reprot (various years), (5) U.S. Census Bureau: International Database, and (6) Secretariat of the Pacific Community: Statistics and Demography Programme.
Categories, topics:
Health, Gender, Social Development
Last updated:
apr 23, 2017
Indicators value changes by year
Minimum:
62.417
jan 1, 1961
Maximum:
72.443
jan 1, 2015
At the date of observation
Value
Absolute change
Change from previous value
jan 1, 1961
62.417
+62.417
0.0%
jan 1, 1962
62.459
+0.042
0.07%
jan 1, 1963
62.477
+0.018
0.03%
jan 1, 1964
62.485
+0.008
0.01%
jan 1, 1965
62.499
+0.014
0.02%
jan 1, 1966
62.536
+0.037
0.06%
jan 1, 1967
62.612
+0.076
0.12%
jan 1, 1968
62.731
+0.119
0.19%
jan 1, 1969
62.893
+0.162
0.26%
jan 1, 1970
63.099
+0.206
0.33%
jan 1, 1971
63.344
+0.245
0.39%
jan 1, 1972
63.618
+0.274
0.43%
jan 1, 1973
63.906
+0.288
0.45%
jan 1, 1974
64.198
+0.292
0.46%
jan 1, 1975
64.485
+0.287
0.45%
jan 1, 1976
64.766
+0.281
0.44%
jan 1, 1977
65.045
+0.279
0.43%
jan 1, 1978
65.327
+0.282
0.43%
jan 1, 1979
65.612
+0.285
0.44%
jan 1, 1980
65.897
+0.285
0.43%
jan 1, 1981
66.174
+0.277
0.42%
jan 1, 1982
66.433
+0.259
0.39%
jan 1, 1983
66.668
+0.235
0.35%
jan 1, 1984
66.877
+0.209
0.31%
jan 1, 1985
67.062
+0.185
0.28%
jan 1, 1986
67.227
+0.165
0.25%
jan 1, 1987
67.382
+0.155
0.23%
jan 1, 1988
67.538
+0.156
0.23%
jan 1, 1989
67.702
+0.164
0.24%
jan 1, 1990
67.879
+0.177
0.26%
jan 1, 1991
68.07
+0.191
0.28%
jan 1, 1992
68.275
+0.205
0.3%
jan 1, 1993
68.487
+0.212
0.31%
jan 1, 1994
68.702
+0.215
0.31%
jan 1, 1995
68.917
+0.215
0.31%
jan 1, 1996
69.13
+0.213
0.31%
jan 1, 1997
69.341
+0.211
0.31%
jan 1, 1998
69.55
+0.209
0.3%
jan 1, 1999
69.755
+0.205
0.29%
jan 1, 2000
69.955
+0.2
0.29%
jan 1, 2001
70.148
+0.193
0.28%
jan 1, 2002
70.333
+0.185
0.26%
jan 1, 2003
70.507
+0.174
0.25%
jan 1, 2004
70.672
+0.165
0.23%
jan 1, 2005
70.83
+0.158
0.22%
jan 1, 2006
70.98
+0.15
0.21%
jan 1, 2007
71.126
+0.146
0.21%
jan 1, 2008
71.271
+0.145
0.2%
jan 1, 2009
71.417
+0.146
0.2%
jan 1, 2010
71.567
+0.15
0.21%
jan 1, 2011
71.724
+0.157
0.22%
jan 1, 2012
71.891
+0.167
0.23%
jan 1, 2013
72.066
+0.175
0.24%
jan 1, 2014
72.25
+0.184
0.26%
jan 1, 2015
72.443
+0.193
0.27%
Ranking of countries by current statistics by years


Comments: