29
/
en
AIzaSyAYiBZKx7MnpbEhh9jyipgxe19OcubqV5w
April 1, 2024
103823
Chad
TCD
true
2
1
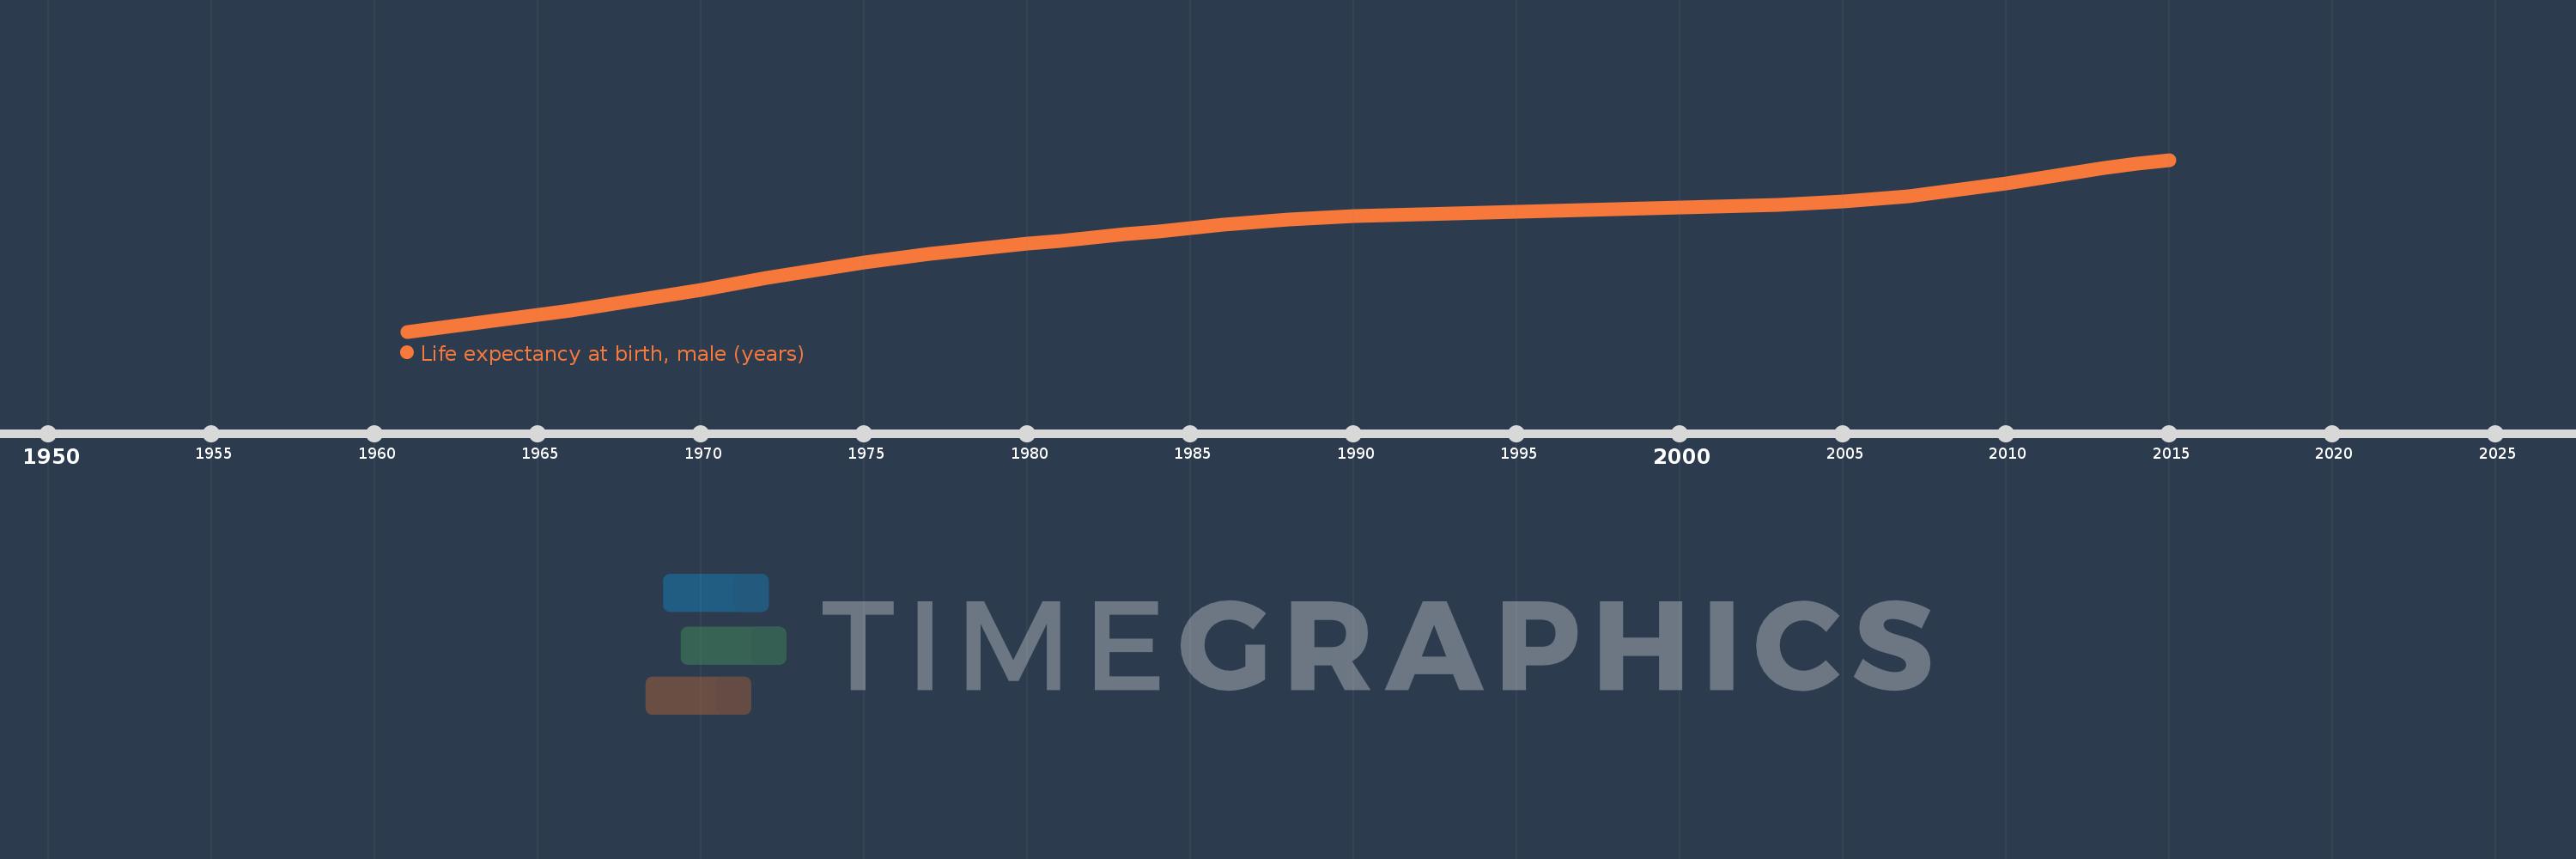
Life expectancy at birth, male (years)
2015,2014,2013,2012,2011,2010,2009,2008,2007,2006,2005,2004,2003,2002,2001,2000,1999,1998,1997,1996,1995,1994,1993,1992,1991,1990,1989,1988,1987,1986,1985,1984,1983,1982,1981,1980,1979,1978,1977,1976,1975,1974,1973,1972,1971,1970,1969,1968,1967,1966,1965,1964,1963,1962,1961
This statistics in other country:
AfghanistanAlbaniaAlgeriaAngolaAntigua and BarbudaArab WorldArgentinaArmeniaArubaAustraliaAustriaAzerbaijanBahamas, TheBahrainBangladeshBarbadosBelarusBelgiumBelizeBeninBermudaBhutanBoliviaBosnia and HerzegovinaBotswanaBrazilBrunei DarussalamBulgariaBurkina FasoBurundiCabo VerdeCambodiaCameroonCanadaCaribbean small statesCentral African RepublicCentral Europe and the BalticsChadChannel IslandsChileChinaColombiaComorosCongo, Dem. Rep.Congo, Rep.Costa RicaCote d'IvoireCroatiaCubaCuracaoCyprusCzech RepublicDenmarkDjiboutiDominicaDominican RepublicEarly-demographic dividendEast Asia & PacificEast Asia & Pacific (excluding high income)East Asia & Pacific (IDA & IBRD countries)EcuadorEgypt, Arab Rep.El SalvadorEquatorial GuineaEritreaEstoniaEthiopiaEuro areaEurope & Central AsiaEurope & Central Asia (excluding high income)Europe & Central Asia (IDA & IBRD countries)European UnionFaroe IslandsFijiFinlandFragile and conflict affected situationsFranceFrench PolynesiaGabonGambia, TheGeorgiaGermanyGhanaGreeceGreenlandGrenadaGuamGuatemalaGuineaGuinea-BissauGuyanaHaitiHeavily indebted poor countries (HIPC)High incomeHondurasHong Kong SAR, ChinaHungaryIBRD onlyIcelandIDA & IBRD totalIDA blendIDA onlyIDA totalIndiaIndonesiaIran, Islamic Rep.IraqIrelandIsle of ManIsraelItalyJamaicaJapanJordanKazakhstanKenyaKiribatiKorea, Dem. People’s Rep.Korea, Rep.KosovoKuwaitKyrgyz RepublicLao PDRLate-demographic dividendLatin America & Caribbean Latin America & Caribbean (excluding high income)Latin America & the Caribbean (IDA & IBRD countries)LatviaLeast developed countries: UN classificationLebanonLesothoLiberiaLibyaLiechtensteinLithuaniaLow & middle incomeLow incomeLower middle incomeLuxembourgMacao SAR, ChinaMacedonia, FYRMadagascarMalawiMalaysiaMaldivesMaliMaltaMarshall IslandsMauritaniaMauritiusMexicoMicronesia, Fed. Sts.Middle East & North AfricaMiddle East & North Africa (excluding high income)Middle East & North Africa (IDA & IBRD countries)Middle incomeMoldovaMongoliaMontenegroMoroccoMozambiqueMyanmarNamibiaNepalNetherlandsNew CaledoniaNew ZealandNicaraguaNigerNigeriaNorth AmericaNorwayOECD membersOmanOther small statesPacific island small statesPakistanPalauPanamaPapua New GuineaParaguayPeruPhilippinesPolandPortugalPost-demographic dividendPre-demographic dividendPuerto RicoQatarRomaniaRussian FederationRwandaSamoaSan MarinoSao Tome and PrincipeSaudi ArabiaSenegalSerbiaSeychellesSierra LeoneSingaporeSint Maarten (Dutch part)Slovak RepublicSloveniaSmall statesSolomon IslandsSomaliaSouth AfricaSouth AsiaSouth Asia (IDA & IBRD)South SudanSpainSri LankaSt. Kitts and NevisSt. LuciaSt. Martin (French part)St. Vincent and the GrenadinesSub-Saharan Africa Sub-Saharan Africa (excluding high income)Sub-Saharan Africa (IDA & IBRD countries)SudanSurinameSwazilandSwedenSwitzerlandSyrian Arab RepublicTajikistanTanzaniaThailandTimor-LesteTogoTongaTrinidad and TobagoTunisiaTurkeyTurkmenistanUgandaUkraineUnited Arab EmiratesUnited KingdomUnited StatesUpper middle incomeUruguayUzbekistanVanuatuVenezuela, RBVietnamVirgin Islands (U.S.)West Bank and GazaWorldYemen, Rep.ZambiaZimbabwe Timeline:
This timeline shows a graph from 1961 to 2015 of Chad. No data until 1960. Number of actual observations by date: 55.
Source name:
World Development Indicators
Source organization:
(1) United Nations Population Division. World Population Prospects, (2) Census reports and other statistical publications from national statistical offices, (3) Eurostat: Demographic Statistics, (4) United Nations Statistical Division. Population and Vital Statistics Reprot (various years), (5) U.S. Census Bureau: International Database, and (6) Secretariat of the Pacific Community: Statistics and Demography Programme.
Categories, topics:
Health, Gender, Social Development
Last updated:
apr 23, 2017
Indicators value changes by year
Minimum:
35.961
jan 1, 1961
Maximum:
50.508
jan 1, 2015
At the date of observation
Value
Absolute change
Change from previous value
jan 1, 1961
35.961
+35.961
0.0%
jan 1, 1962
36.311
+0.35
0.97%
jan 1, 1963
36.663
+0.352
0.97%
jan 1, 1964
37.02
+0.357
0.97%
jan 1, 1965
37.385
+0.365
0.99%
jan 1, 1966
37.764
+0.379
1.01%
jan 1, 1967
38.167
+0.403
1.07%
jan 1, 1968
38.597
+0.43
1.13%
jan 1, 1969
39.051
+0.454
1.18%
jan 1, 1970
39.525
+0.474
1.21%
jan 1, 1971
40.009
+0.484
1.22%
jan 1, 1972
40.49
+0.481
1.2%
jan 1, 1973
40.956
+0.466
1.15%
jan 1, 1974
41.396
+0.44
1.07%
jan 1, 1975
41.804
+0.408
0.99%
jan 1, 1976
42.176
+0.372
0.89%
jan 1, 1977
42.513
+0.337
0.8%
jan 1, 1978
42.822
+0.309
0.73%
jan 1, 1979
43.112
+0.29
0.68%
jan 1, 1980
43.387
+0.275
0.64%
jan 1, 1981
43.654
+0.267
0.62%
jan 1, 1982
43.922
+0.268
0.61%
jan 1, 1983
44.193
+0.271
0.62%
jan 1, 1984
44.465
+0.272
0.62%
jan 1, 1985
44.736
+0.271
0.61%
jan 1, 1986
44.995
+0.259
0.58%
jan 1, 1987
45.23
+0.235
0.52%
jan 1, 1988
45.429
+0.199
0.44%
jan 1, 1989
45.588
+0.159
0.35%
jan 1, 1990
45.709
+0.121
0.27%
jan 1, 1991
45.799
+0.09
0.2%
jan 1, 1992
45.87
+0.071
0.16%
jan 1, 1993
45.936
+0.066
0.14%
jan 1, 1994
46.008
+0.072
0.16%
jan 1, 1995
46.091
+0.083
0.18%
jan 1, 1996
46.182
+0.091
0.2%
jan 1, 1997
46.274
+0.092
0.2%
jan 1, 1998
46.358
+0.084
0.18%
jan 1, 1999
46.432
+0.074
0.16%
jan 1, 2000
46.497
+0.065
0.14%
jan 1, 2001
46.561
+0.064
0.14%
jan 1, 2002
46.632
+0.071
0.15%
jan 1, 2003
46.72
+0.088
0.19%
jan 1, 2004
46.836
+0.116
0.25%
jan 1, 2005
46.989
+0.153
0.33%
jan 1, 2006
47.19
+0.201
0.43%
jan 1, 2007
47.451
+0.261
0.55%
jan 1, 2008
47.768
+0.317
0.67%
jan 1, 2009
48.135
+0.367
0.77%
jan 1, 2010
48.54
+0.405
0.84%
jan 1, 2011
48.965
+0.425
0.88%
jan 1, 2012
49.39
+0.425
0.87%
jan 1, 2013
49.797
+0.407
0.82%
jan 1, 2014
50.171
+0.374
0.75%
jan 1, 2015
50.508
+0.337
0.67%
Ranking of countries by current statistics by years


Comments: