29
/
en
AIzaSyAYiBZKx7MnpbEhh9jyipgxe19OcubqV5w
April 1, 2024
35899
High income
HIC
false
2
1
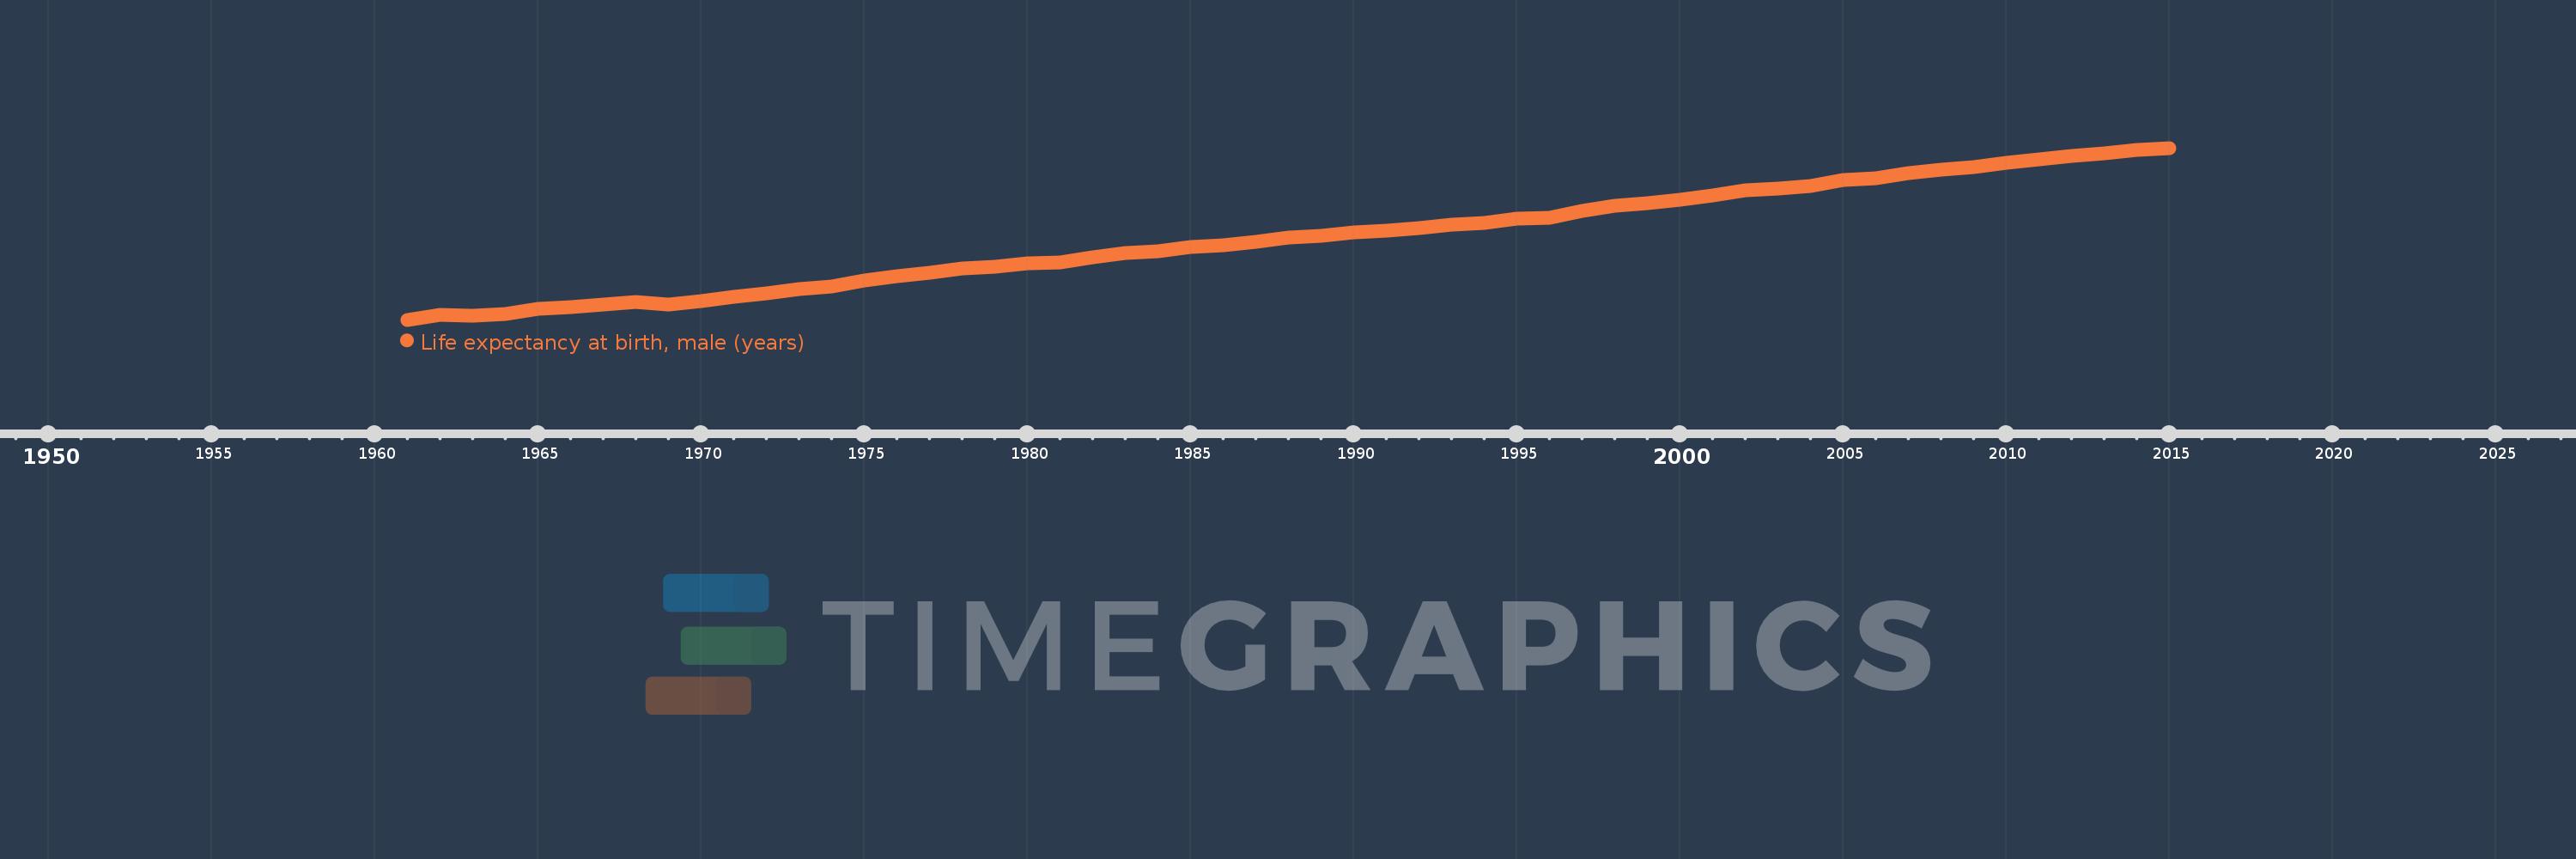
Life expectancy at birth, male (years)
2015,2014,2013,2012,2011,2010,2009,2008,2007,2006,2005,2004,2003,2002,2001,2000,1999,1998,1997,1996,1995,1994,1993,1992,1991,1990,1989,1988,1987,1986,1985,1984,1983,1982,1981,1980,1979,1978,1977,1976,1975,1974,1973,1972,1971,1970,1969,1968,1967,1966,1965,1964,1963,1962,1961
This statistics in other country:
AfghanistanAlbaniaAlgeriaAngolaAntigua and BarbudaArab WorldArgentinaArmeniaArubaAustraliaAustriaAzerbaijanBahamas, TheBahrainBangladeshBarbadosBelarusBelgiumBelizeBeninBermudaBhutanBoliviaBosnia and HerzegovinaBotswanaBrazilBrunei DarussalamBulgariaBurkina FasoBurundiCabo VerdeCambodiaCameroonCanadaCaribbean small statesCentral African RepublicCentral Europe and the BalticsChadChannel IslandsChileChinaColombiaComorosCongo, Dem. Rep.Congo, Rep.Costa RicaCote d'IvoireCroatiaCubaCuracaoCyprusCzech RepublicDenmarkDjiboutiDominicaDominican RepublicEarly-demographic dividendEast Asia & PacificEast Asia & Pacific (excluding high income)East Asia & Pacific (IDA & IBRD countries)EcuadorEgypt, Arab Rep.El SalvadorEquatorial GuineaEritreaEstoniaEthiopiaEuro areaEurope & Central AsiaEurope & Central Asia (excluding high income)Europe & Central Asia (IDA & IBRD countries)European UnionFaroe IslandsFijiFinlandFragile and conflict affected situationsFranceFrench PolynesiaGabonGambia, TheGeorgiaGermanyGhanaGreeceGreenlandGrenadaGuamGuatemalaGuineaGuinea-BissauGuyanaHaitiHeavily indebted poor countries (HIPC)High incomeHondurasHong Kong SAR, ChinaHungaryIBRD onlyIcelandIDA & IBRD totalIDA blendIDA onlyIDA totalIndiaIndonesiaIran, Islamic Rep.IraqIrelandIsle of ManIsraelItalyJamaicaJapanJordanKazakhstanKenyaKiribatiKorea, Dem. People’s Rep.Korea, Rep.KosovoKuwaitKyrgyz RepublicLao PDRLate-demographic dividendLatin America & Caribbean Latin America & Caribbean (excluding high income)Latin America & the Caribbean (IDA & IBRD countries)LatviaLeast developed countries: UN classificationLebanonLesothoLiberiaLibyaLiechtensteinLithuaniaLow & middle incomeLow incomeLower middle incomeLuxembourgMacao SAR, ChinaMacedonia, FYRMadagascarMalawiMalaysiaMaldivesMaliMaltaMarshall IslandsMauritaniaMauritiusMexicoMicronesia, Fed. Sts.Middle East & North AfricaMiddle East & North Africa (excluding high income)Middle East & North Africa (IDA & IBRD countries)Middle incomeMoldovaMongoliaMontenegroMoroccoMozambiqueMyanmarNamibiaNepalNetherlandsNew CaledoniaNew ZealandNicaraguaNigerNigeriaNorth AmericaNorwayOECD membersOmanOther small statesPacific island small statesPakistanPalauPanamaPapua New GuineaParaguayPeruPhilippinesPolandPortugalPost-demographic dividendPre-demographic dividendPuerto RicoQatarRomaniaRussian FederationRwandaSamoaSan MarinoSao Tome and PrincipeSaudi ArabiaSenegalSerbiaSeychellesSierra LeoneSingaporeSint Maarten (Dutch part)Slovak RepublicSloveniaSmall statesSolomon IslandsSomaliaSouth AfricaSouth AsiaSouth Asia (IDA & IBRD)South SudanSpainSri LankaSt. Kitts and NevisSt. LuciaSt. Martin (French part)St. Vincent and the GrenadinesSub-Saharan Africa Sub-Saharan Africa (excluding high income)Sub-Saharan Africa (IDA & IBRD countries)SudanSurinameSwazilandSwedenSwitzerlandSyrian Arab RepublicTajikistanTanzaniaThailandTimor-LesteTogoTongaTrinidad and TobagoTunisiaTurkeyTurkmenistanUgandaUkraineUnited Arab EmiratesUnited KingdomUnited StatesUpper middle incomeUruguayUzbekistanVanuatuVenezuela, RBVietnamVirgin Islands (U.S.)West Bank and GazaWorldYemen, Rep.ZambiaZimbabwe Timeline:
This timeline shows a graph from 1961 to 2015 of High income. No data until 1960. Number of actual observations by date: 55.
Source name:
World Development Indicators
Source organization:
(1) United Nations Population Division. World Population Prospects, (2) Census reports and other statistical publications from national statistical offices, (3) Eurostat: Demographic Statistics, (4) United Nations Statistical Division. Population and Vital Statistics Reprot (various years), (5) U.S. Census Bureau: International Database, and (6) Secretariat of the Pacific Community: Statistics and Demography Programme.
Categories, topics:
Health, Gender, Social Development
Last updated:
apr 23, 2017
Indicators value changes by year
Minimum:
65.766
jan 1, 1961
Maximum:
78.044
jan 1, 2015
At the date of observation
Value
Absolute change
Change from previous value
jan 1, 1961
65.766
+65.766
0.0%
jan 1, 1962
66.12
+0.354
0.54%
jan 1, 1963
66.056
-0.064
-0.1%
jan 1, 1964
66.203
+0.147
0.22%
jan 1, 1965
66.563
+0.36
0.54%
jan 1, 1966
66.645
+0.082
0.12%
jan 1, 1967
66.867
+0.222
0.33%
jan 1, 1968
67.063
+0.195
0.29%
jan 1, 1969
66.882
-0.181
-0.27%
jan 1, 1970
67.088
+0.206
0.31%
jan 1, 1971
67.413
+0.325
0.48%
jan 1, 1972
67.665
+0.252
0.37%
jan 1, 1973
67.96
+0.295
0.44%
jan 1, 1974
68.139
+0.179
0.26%
jan 1, 1975
68.57
+0.431
0.63%
jan 1, 1976
68.887
+0.317
0.46%
jan 1, 1977
69.136
+0.249
0.36%
jan 1, 1978
69.44
+0.304
0.44%
jan 1, 1979
69.554
+0.115
0.16%
jan 1, 1980
69.825
+0.271
0.39%
jan 1, 1981
69.859
+0.034
0.05%
jan 1, 1982
70.212
+0.354
0.51%
jan 1, 1983
70.556
+0.344
0.49%
jan 1, 1984
70.671
+0.115
0.16%
jan 1, 1985
70.937
+0.266
0.38%
jan 1, 1986
71.072
+0.135
0.19%
jan 1, 1987
71.347
+0.274
0.39%
jan 1, 1988
71.623
+0.277
0.39%
jan 1, 1989
71.749
+0.126
0.18%
jan 1, 1990
71.995
+0.246
0.34%
jan 1, 1991
72.113
+0.118
0.16%
jan 1, 1992
72.287
+0.174
0.24%
jan 1, 1993
72.556
+0.27
0.37%
jan 1, 1994
72.686
+0.13
0.18%
jan 1, 1995
72.968
+0.282
0.39%
jan 1, 1996
73.074
+0.106
0.14%
jan 1, 1997
73.532
+0.458
0.63%
jan 1, 1998
73.904
+0.372
0.51%
jan 1, 1999
74.123
+0.22
0.3%
jan 1, 2000
74.343
+0.219
0.3%
jan 1, 2001
74.668
+0.325
0.44%
jan 1, 2002
75.007
+0.338
0.45%
jan 1, 2003
75.158
+0.152
0.2%
jan 1, 2004
75.33
+0.171
0.23%
jan 1, 2005
75.778
+0.448
0.59%
jan 1, 2006
75.904
+0.126
0.17%
jan 1, 2007
76.226
+0.322
0.42%
jan 1, 2008
76.477
+0.251
0.33%
jan 1, 2009
76.674
+0.198
0.26%
jan 1, 2010
76.977
+0.302
0.39%
jan 1, 2011
77.199
+0.223
0.29%
jan 1, 2012
77.486
+0.287
0.37%
jan 1, 2013
77.65
+0.164
0.21%
jan 1, 2014
77.889
+0.239
0.31%
jan 1, 2015
78.044
+0.155
0.2%
Ranking of countries by current statistics by years


Comments: