29
/
en
AIzaSyAYiBZKx7MnpbEhh9jyipgxe19OcubqV5w
April 1, 2024
169309
Korea, Dem. People’s Rep.
PRK
true
2
1
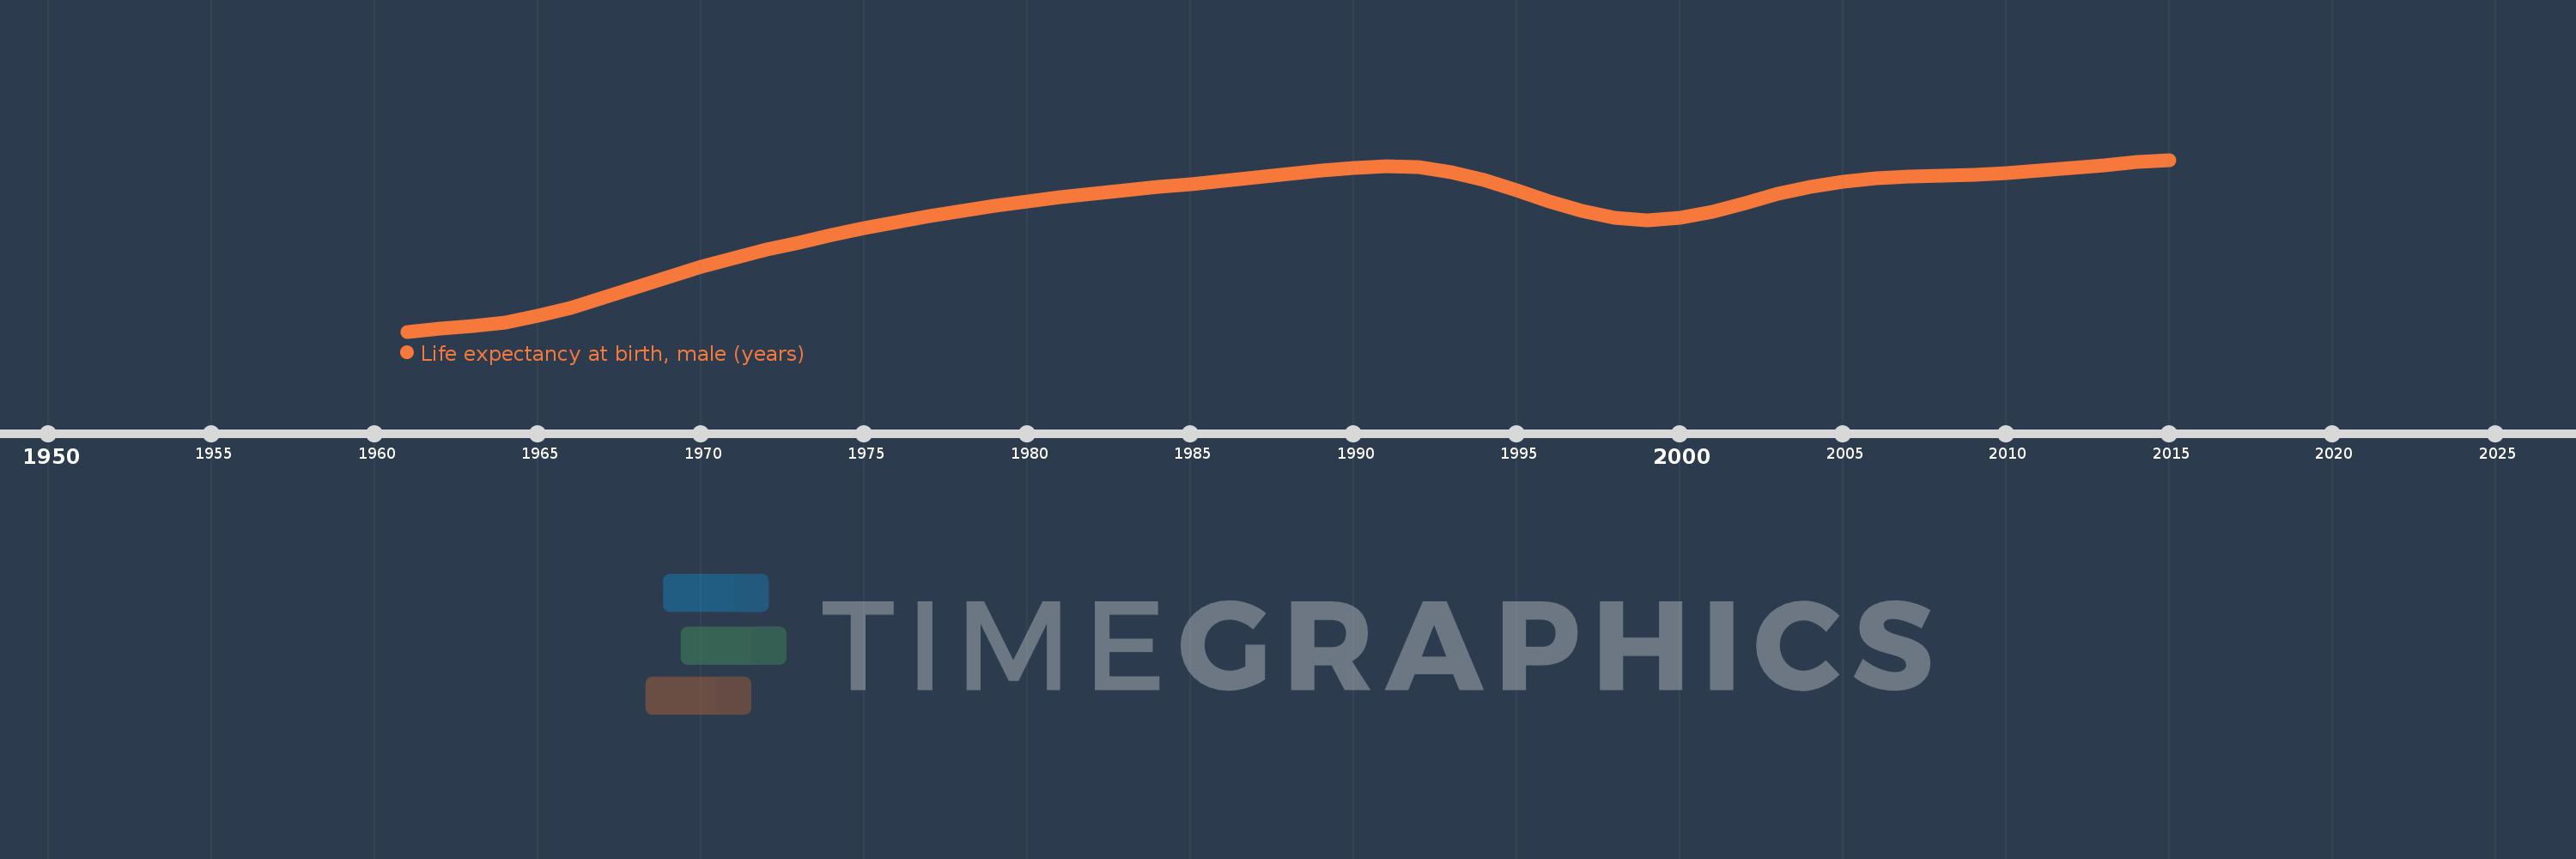
Life expectancy at birth, male (years)
2015,2014,2013,2012,2011,2010,2009,2008,2007,2006,2005,2004,2003,2002,2001,2000,1999,1998,1997,1996,1995,1994,1993,1992,1991,1990,1989,1988,1987,1986,1985,1984,1983,1982,1981,1980,1979,1978,1977,1976,1975,1974,1973,1972,1971,1970,1969,1968,1967,1966,1965,1964,1963,1962,1961
This statistics in other country:
AfghanistanAlbaniaAlgeriaAngolaAntigua and BarbudaArab WorldArgentinaArmeniaArubaAustraliaAustriaAzerbaijanBahamas, TheBahrainBangladeshBarbadosBelarusBelgiumBelizeBeninBermudaBhutanBoliviaBosnia and HerzegovinaBotswanaBrazilBrunei DarussalamBulgariaBurkina FasoBurundiCabo VerdeCambodiaCameroonCanadaCaribbean small statesCentral African RepublicCentral Europe and the BalticsChadChannel IslandsChileChinaColombiaComorosCongo, Dem. Rep.Congo, Rep.Costa RicaCote d'IvoireCroatiaCubaCuracaoCyprusCzech RepublicDenmarkDjiboutiDominicaDominican RepublicEarly-demographic dividendEast Asia & PacificEast Asia & Pacific (excluding high income)East Asia & Pacific (IDA & IBRD countries)EcuadorEgypt, Arab Rep.El SalvadorEquatorial GuineaEritreaEstoniaEthiopiaEuro areaEurope & Central AsiaEurope & Central Asia (excluding high income)Europe & Central Asia (IDA & IBRD countries)European UnionFaroe IslandsFijiFinlandFragile and conflict affected situationsFranceFrench PolynesiaGabonGambia, TheGeorgiaGermanyGhanaGreeceGreenlandGrenadaGuamGuatemalaGuineaGuinea-BissauGuyanaHaitiHeavily indebted poor countries (HIPC)High incomeHondurasHong Kong SAR, ChinaHungaryIBRD onlyIcelandIDA & IBRD totalIDA blendIDA onlyIDA totalIndiaIndonesiaIran, Islamic Rep.IraqIrelandIsle of ManIsraelItalyJamaicaJapanJordanKazakhstanKenyaKiribatiKorea, Dem. People’s Rep.Korea, Rep.KosovoKuwaitKyrgyz RepublicLao PDRLate-demographic dividendLatin America & Caribbean Latin America & Caribbean (excluding high income)Latin America & the Caribbean (IDA & IBRD countries)LatviaLeast developed countries: UN classificationLebanonLesothoLiberiaLibyaLiechtensteinLithuaniaLow & middle incomeLow incomeLower middle incomeLuxembourgMacao SAR, ChinaMacedonia, FYRMadagascarMalawiMalaysiaMaldivesMaliMaltaMarshall IslandsMauritaniaMauritiusMexicoMicronesia, Fed. Sts.Middle East & North AfricaMiddle East & North Africa (excluding high income)Middle East & North Africa (IDA & IBRD countries)Middle incomeMoldovaMongoliaMontenegroMoroccoMozambiqueMyanmarNamibiaNepalNetherlandsNew CaledoniaNew ZealandNicaraguaNigerNigeriaNorth AmericaNorwayOECD membersOmanOther small statesPacific island small statesPakistanPalauPanamaPapua New GuineaParaguayPeruPhilippinesPolandPortugalPost-demographic dividendPre-demographic dividendPuerto RicoQatarRomaniaRussian FederationRwandaSamoaSan MarinoSao Tome and PrincipeSaudi ArabiaSenegalSerbiaSeychellesSierra LeoneSingaporeSint Maarten (Dutch part)Slovak RepublicSloveniaSmall statesSolomon IslandsSomaliaSouth AfricaSouth AsiaSouth Asia (IDA & IBRD)South SudanSpainSri LankaSt. Kitts and NevisSt. LuciaSt. Martin (French part)St. Vincent and the GrenadinesSub-Saharan Africa Sub-Saharan Africa (excluding high income)Sub-Saharan Africa (IDA & IBRD countries)SudanSurinameSwazilandSwedenSwitzerlandSyrian Arab RepublicTajikistanTanzaniaThailandTimor-LesteTogoTongaTrinidad and TobagoTunisiaTurkeyTurkmenistanUgandaUkraineUnited Arab EmiratesUnited KingdomUnited StatesUpper middle incomeUruguayUzbekistanVanuatuVenezuela, RBVietnamVirgin Islands (U.S.)West Bank and GazaWorldYemen, Rep.ZambiaZimbabwe Timeline:
This timeline shows a graph from 1961 to 2015 of Korea, Dem. People’s Rep.. No data until 1960. Number of actual observations by date: 55.
Source name:
World Development Indicators
Source organization:
(1) United Nations Population Division. World Population Prospects, (2) Census reports and other statistical publications from national statistical offices, (3) Eurostat: Demographic Statistics, (4) United Nations Statistical Division. Population and Vital Statistics Reprot (various years), (5) U.S. Census Bureau: International Database, and (6) Secretariat of the Pacific Community: Statistics and Demography Programme.
Categories, topics:
Health, Gender, Social Development
Last updated:
apr 23, 2017
Indicators value changes by year
Minimum:
48.424
jan 1, 1961
Maximum:
66.662
jan 1, 2015
At the date of observation
Value
Absolute change
Change from previous value
jan 1, 1961
48.424
+48.424
0.0%
jan 1, 1962
48.708
+0.284
0.59%
jan 1, 1963
48.998
+0.29
0.6%
jan 1, 1964
49.427
+0.429
0.88%
jan 1, 1965
50.07
+0.643
1.3%
jan 1, 1966
50.945
+0.875
1.75%
jan 1, 1967
52.01
+1.065
2.09%
jan 1, 1968
53.142
+1.132
2.18%
jan 1, 1969
54.243
+1.101
2.07%
jan 1, 1970
55.277
+1.034
1.91%
jan 1, 1971
56.228
+0.951
1.72%
jan 1, 1972
57.095
+0.867
1.54%
jan 1, 1973
57.902
+0.807
1.41%
jan 1, 1974
58.665
+0.763
1.32%
jan 1, 1975
59.386
+0.721
1.23%
jan 1, 1976
60.059
+0.673
1.13%
jan 1, 1977
60.682
+0.623
1.04%
jan 1, 1978
61.251
+0.569
0.94%
jan 1, 1979
61.768
+0.517
0.84%
jan 1, 1980
62.237
+0.469
0.76%
jan 1, 1981
62.662
+0.425
0.68%
jan 1, 1982
63.053
+0.391
0.62%
jan 1, 1983
63.414
+0.361
0.57%
jan 1, 1984
63.754
+0.34
0.54%
jan 1, 1985
64.074
+0.32
0.5%
jan 1, 1986
64.397
+0.323
0.5%
jan 1, 1987
64.752
+0.355
0.55%
jan 1, 1988
65.131
+0.379
0.59%
jan 1, 1989
65.505
+0.374
0.57%
jan 1, 1990
65.833
+0.328
0.5%
jan 1, 1991
65.997
+0.164
0.25%
jan 1, 1992
65.858
-0.139
-0.21%
jan 1, 1993
65.36
-0.498
-0.76%
jan 1, 1994
64.521
-0.839
-1.28%
jan 1, 1995
63.417
-1.104
-1.71%
jan 1, 1996
62.229
-1.188
-1.87%
jan 1, 1997
61.192
-1.037
-1.67%
jan 1, 1998
60.5
-0.692
-1.13%
jan 1, 1999
60.272
-0.228
-0.38%
jan 1, 2000
60.526
+0.254
0.42%
jan 1, 2001
61.185
+0.659
1.09%
jan 1, 2002
62.09
+0.905
1.48%
jan 1, 2003
63.02
+0.93
1.5%
jan 1, 2004
63.804
+0.784
1.24%
jan 1, 2005
64.373
+0.569
0.89%
jan 1, 2006
64.717
+0.344
0.53%
jan 1, 2007
64.883
+0.166
0.26%
jan 1, 2008
64.984
+0.101
0.16%
jan 1, 2009
65.11
+0.126
0.19%
jan 1, 2010
65.286
+0.176
0.27%
jan 1, 2011
65.521
+0.235
0.36%
jan 1, 2012
65.804
+0.283
0.43%
jan 1, 2013
66.102
+0.298
0.45%
jan 1, 2014
66.39
+0.288
0.44%
jan 1, 2015
66.662
+0.272
0.41%
Ranking of countries by current statistics by years


Comments: