29
/
en
AIzaSyAYiBZKx7MnpbEhh9jyipgxe19OcubqV5w
April 1, 2024
52010
North America
NAC
false
2
1
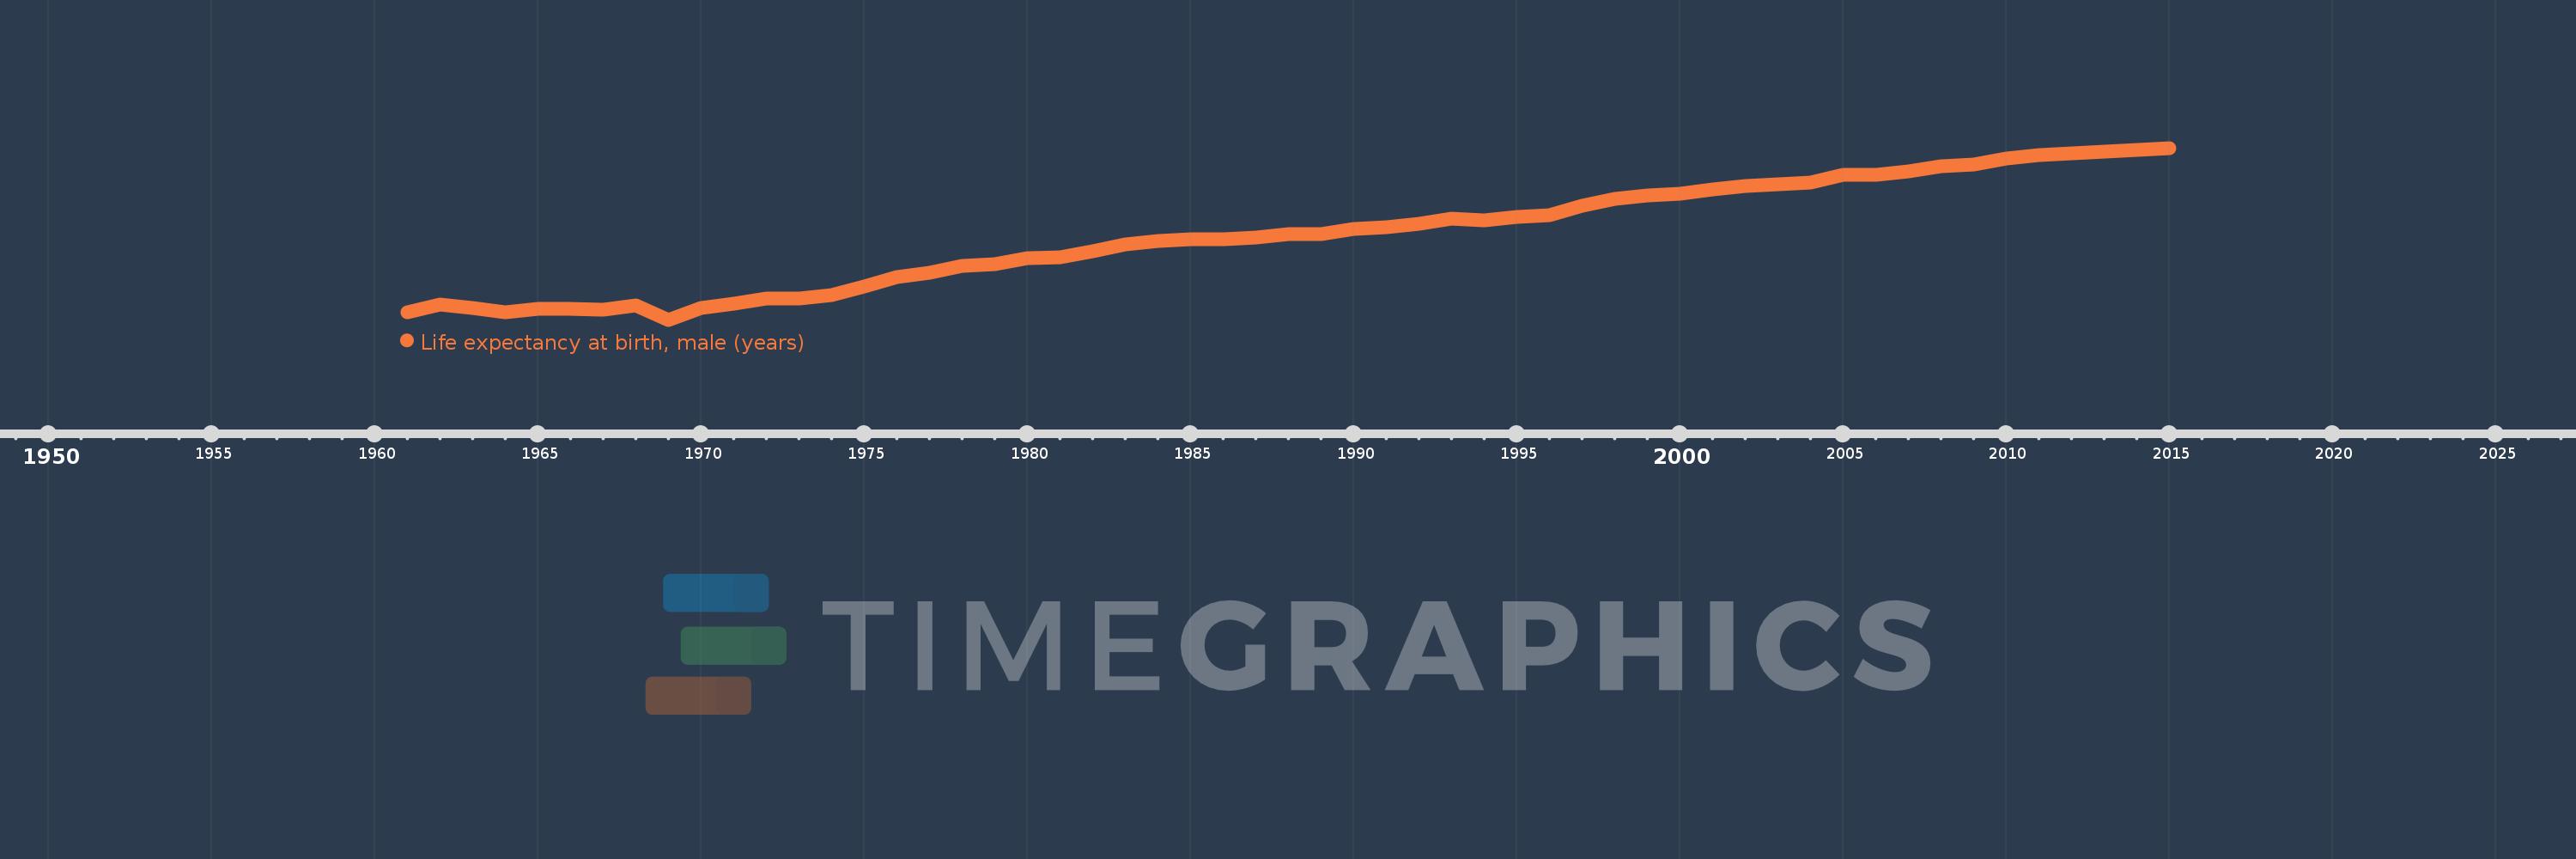
Life expectancy at birth, male (years)
2015,2014,2013,2012,2011,2010,2009,2008,2007,2006,2005,2004,2003,2002,2001,2000,1999,1998,1997,1996,1995,1994,1993,1992,1991,1990,1989,1988,1987,1986,1985,1984,1983,1982,1981,1980,1979,1978,1977,1976,1975,1974,1973,1972,1971,1970,1969,1968,1967,1966,1965,1964,1963,1962,1961
This statistics in other country:
AfghanistanAlbaniaAlgeriaAngolaAntigua and BarbudaArab WorldArgentinaArmeniaArubaAustraliaAustriaAzerbaijanBahamas, TheBahrainBangladeshBarbadosBelarusBelgiumBelizeBeninBermudaBhutanBoliviaBosnia and HerzegovinaBotswanaBrazilBrunei DarussalamBulgariaBurkina FasoBurundiCabo VerdeCambodiaCameroonCanadaCaribbean small statesCentral African RepublicCentral Europe and the BalticsChadChannel IslandsChileChinaColombiaComorosCongo, Dem. Rep.Congo, Rep.Costa RicaCote d'IvoireCroatiaCubaCuracaoCyprusCzech RepublicDenmarkDjiboutiDominicaDominican RepublicEarly-demographic dividendEast Asia & PacificEast Asia & Pacific (excluding high income)East Asia & Pacific (IDA & IBRD countries)EcuadorEgypt, Arab Rep.El SalvadorEquatorial GuineaEritreaEstoniaEthiopiaEuro areaEurope & Central AsiaEurope & Central Asia (excluding high income)Europe & Central Asia (IDA & IBRD countries)European UnionFaroe IslandsFijiFinlandFragile and conflict affected situationsFranceFrench PolynesiaGabonGambia, TheGeorgiaGermanyGhanaGreeceGreenlandGrenadaGuamGuatemalaGuineaGuinea-BissauGuyanaHaitiHeavily indebted poor countries (HIPC)High incomeHondurasHong Kong SAR, ChinaHungaryIBRD onlyIcelandIDA & IBRD totalIDA blendIDA onlyIDA totalIndiaIndonesiaIran, Islamic Rep.IraqIrelandIsle of ManIsraelItalyJamaicaJapanJordanKazakhstanKenyaKiribatiKorea, Dem. People’s Rep.Korea, Rep.KosovoKuwaitKyrgyz RepublicLao PDRLate-demographic dividendLatin America & Caribbean Latin America & Caribbean (excluding high income)Latin America & the Caribbean (IDA & IBRD countries)LatviaLeast developed countries: UN classificationLebanonLesothoLiberiaLibyaLiechtensteinLithuaniaLow & middle incomeLow incomeLower middle incomeLuxembourgMacao SAR, ChinaMacedonia, FYRMadagascarMalawiMalaysiaMaldivesMaliMaltaMarshall IslandsMauritaniaMauritiusMexicoMicronesia, Fed. Sts.Middle East & North AfricaMiddle East & North Africa (excluding high income)Middle East & North Africa (IDA & IBRD countries)Middle incomeMoldovaMongoliaMontenegroMoroccoMozambiqueMyanmarNamibiaNepalNetherlandsNew CaledoniaNew ZealandNicaraguaNigerNigeriaNorth AmericaNorwayOECD membersOmanOther small statesPacific island small statesPakistanPalauPanamaPapua New GuineaParaguayPeruPhilippinesPolandPortugalPost-demographic dividendPre-demographic dividendPuerto RicoQatarRomaniaRussian FederationRwandaSamoaSan MarinoSao Tome and PrincipeSaudi ArabiaSenegalSerbiaSeychellesSierra LeoneSingaporeSint Maarten (Dutch part)Slovak RepublicSloveniaSmall statesSolomon IslandsSomaliaSouth AfricaSouth AsiaSouth Asia (IDA & IBRD)South SudanSpainSri LankaSt. Kitts and NevisSt. LuciaSt. Martin (French part)St. Vincent and the GrenadinesSub-Saharan Africa Sub-Saharan Africa (excluding high income)Sub-Saharan Africa (IDA & IBRD countries)SudanSurinameSwazilandSwedenSwitzerlandSyrian Arab RepublicTajikistanTanzaniaThailandTimor-LesteTogoTongaTrinidad and TobagoTunisiaTurkeyTurkmenistanUgandaUkraineUnited Arab EmiratesUnited KingdomUnited StatesUpper middle incomeUruguayUzbekistanVanuatuVenezuela, RBVietnamVirgin Islands (U.S.)West Bank and GazaWorldYemen, Rep.ZambiaZimbabwe Timeline:
This timeline shows a graph from 1961 to 2015 of North America. No data until 1960. Number of actual observations by date: 55.
Source name:
World Development Indicators
Source organization:
(1) United Nations Population Division. World Population Prospects, (2) Census reports and other statistical publications from national statistical offices, (3) Eurostat: Demographic Statistics, (4) United Nations Statistical Division. Population and Vital Statistics Reprot (various years), (5) U.S. Census Bureau: International Database, and (6) Secretariat of the Pacific Community: Statistics and Demography Programme.
Categories, topics:
Health, Gender, Social Development
Last updated:
apr 23, 2017
Indicators value changes by year
Minimum:
66.294
jan 1, 1969
Maximum:
76.943
jan 1, 2015
At the date of observation
Value
Absolute change
Change from previous value
jan 1, 1961
66.752
+66.752
0.0%
jan 1, 1962
67.219
+0.466
0.7%
jan 1, 1963
67.043
-0.176
-0.26%
jan 1, 1964
66.768
-0.275
-0.41%
jan 1, 1965
66.97
+0.203
0.3%
jan 1, 1966
66.983
+0.013
0.02%
jan 1, 1967
66.895
-0.088
-0.13%
jan 1, 1968
67.182
+0.286
0.43%
jan 1, 1969
66.294
-0.888
-1.32%
jan 1, 1970
67.025
+0.731
1.1%
jan 1, 1971
67.313
+0.287
0.43%
jan 1, 1972
67.611
+0.299
0.44%
jan 1, 1973
67.602
-0.01
-0.01%
jan 1, 1974
67.801
+0.199
0.29%
jan 1, 1975
68.351
+0.55
0.81%
jan 1, 1976
68.917
+0.567
0.83%
jan 1, 1977
69.219
+0.301
0.44%
jan 1, 1978
69.613
+0.394
0.57%
jan 1, 1979
69.731
+0.118
0.17%
jan 1, 1980
70.13
+0.4
0.57%
jan 1, 1981
70.159
+0.028
0.04%
jan 1, 1982
70.561
+0.402
0.57%
jan 1, 1983
70.949
+0.388
0.55%
jan 1, 1984
71.168
+0.219
0.31%
jan 1, 1985
71.291
+0.123
0.17%
jan 1, 1986
71.293
+0.002
0.0%
jan 1, 1987
71.403
+0.11
0.15%
jan 1, 1988
71.612
+0.209
0.29%
jan 1, 1989
71.618
+0.007
0.01%
jan 1, 1990
71.921
+0.303
0.42%
jan 1, 1991
72.049
+0.128
0.18%
jan 1, 1992
72.252
+0.203
0.28%
jan 1, 1993
72.547
+0.295
0.41%
jan 1, 1994
72.451
-0.097
-0.13%
jan 1, 1995
72.655
+0.204
0.28%
jan 1, 1996
72.758
+0.103
0.14%
jan 1, 1997
73.334
+0.577
0.79%
jan 1, 1998
73.809
+0.475
0.65%
jan 1, 1999
74.014
+0.205
0.28%
jan 1, 2000
74.127
+0.113
0.15%
jan 1, 2001
74.357
+0.229
0.31%
jan 1, 2002
74.566
+0.21
0.28%
jan 1, 2003
74.676
+0.11
0.15%
jan 1, 2004
74.786
+0.11
0.15%
jan 1, 2005
75.277
+0.49
0.66%
jan 1, 2006
75.296
+0.02
0.03%
jan 1, 2007
75.493
+0.197
0.26%
jan 1, 2008
75.787
+0.294
0.39%
jan 1, 2009
75.9
+0.113
0.15%
jan 1, 2010
76.294
+0.394
0.52%
jan 1, 2011
76.511
+0.217
0.28%
jan 1, 2012
76.596
+0.086
0.11%
jan 1, 2013
76.713
+0.117
0.15%
jan 1, 2014
76.829
+0.116
0.15%
jan 1, 2015
76.943
+0.114
0.15%
Ranking of countries by current statistics by years


Comments: