29
/
en
AIzaSyAYiBZKx7MnpbEhh9jyipgxe19OcubqV5w
April 1, 2024
188024
Malaysia
MYS
true
2
1
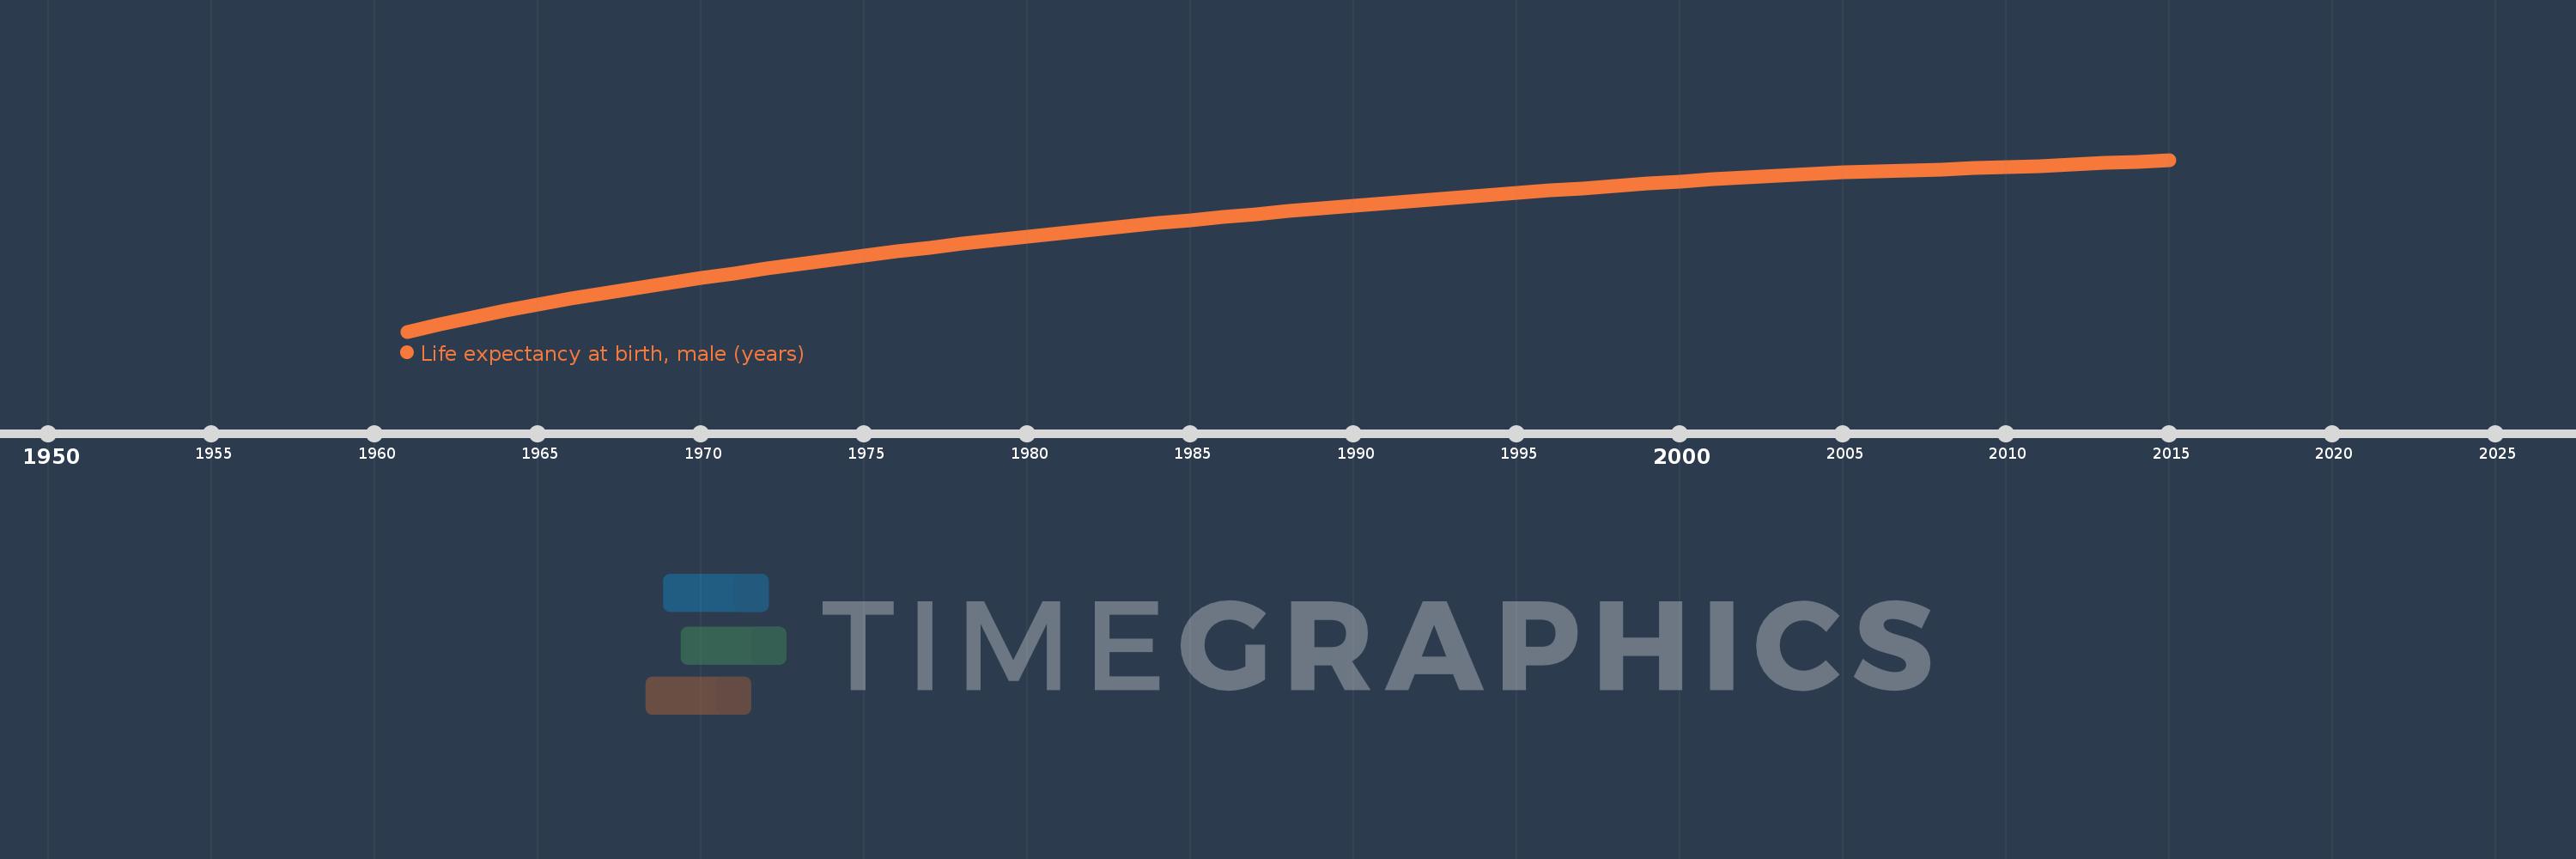
Life expectancy at birth, male (years)
2015,2014,2013,2012,2011,2010,2009,2008,2007,2006,2005,2004,2003,2002,2001,2000,1999,1998,1997,1996,1995,1994,1993,1992,1991,1990,1989,1988,1987,1986,1985,1984,1983,1982,1981,1980,1979,1978,1977,1976,1975,1974,1973,1972,1971,1970,1969,1968,1967,1966,1965,1964,1963,1962,1961
This statistics in other country:
AfghanistanAlbaniaAlgeriaAngolaAntigua and BarbudaArab WorldArgentinaArmeniaArubaAustraliaAustriaAzerbaijanBahamas, TheBahrainBangladeshBarbadosBelarusBelgiumBelizeBeninBermudaBhutanBoliviaBosnia and HerzegovinaBotswanaBrazilBrunei DarussalamBulgariaBurkina FasoBurundiCabo VerdeCambodiaCameroonCanadaCaribbean small statesCentral African RepublicCentral Europe and the BalticsChadChannel IslandsChileChinaColombiaComorosCongo, Dem. Rep.Congo, Rep.Costa RicaCote d'IvoireCroatiaCubaCuracaoCyprusCzech RepublicDenmarkDjiboutiDominicaDominican RepublicEarly-demographic dividendEast Asia & PacificEast Asia & Pacific (excluding high income)East Asia & Pacific (IDA & IBRD countries)EcuadorEgypt, Arab Rep.El SalvadorEquatorial GuineaEritreaEstoniaEthiopiaEuro areaEurope & Central AsiaEurope & Central Asia (excluding high income)Europe & Central Asia (IDA & IBRD countries)European UnionFaroe IslandsFijiFinlandFragile and conflict affected situationsFranceFrench PolynesiaGabonGambia, TheGeorgiaGermanyGhanaGreeceGreenlandGrenadaGuamGuatemalaGuineaGuinea-BissauGuyanaHaitiHeavily indebted poor countries (HIPC)High incomeHondurasHong Kong SAR, ChinaHungaryIBRD onlyIcelandIDA & IBRD totalIDA blendIDA onlyIDA totalIndiaIndonesiaIran, Islamic Rep.IraqIrelandIsle of ManIsraelItalyJamaicaJapanJordanKazakhstanKenyaKiribatiKorea, Dem. People’s Rep.Korea, Rep.KosovoKuwaitKyrgyz RepublicLao PDRLate-demographic dividendLatin America & Caribbean Latin America & Caribbean (excluding high income)Latin America & the Caribbean (IDA & IBRD countries)LatviaLeast developed countries: UN classificationLebanonLesothoLiberiaLibyaLiechtensteinLithuaniaLow & middle incomeLow incomeLower middle incomeLuxembourgMacao SAR, ChinaMacedonia, FYRMadagascarMalawiMalaysiaMaldivesMaliMaltaMarshall IslandsMauritaniaMauritiusMexicoMicronesia, Fed. Sts.Middle East & North AfricaMiddle East & North Africa (excluding high income)Middle East & North Africa (IDA & IBRD countries)Middle incomeMoldovaMongoliaMontenegroMoroccoMozambiqueMyanmarNamibiaNepalNetherlandsNew CaledoniaNew ZealandNicaraguaNigerNigeriaNorth AmericaNorwayOECD membersOmanOther small statesPacific island small statesPakistanPalauPanamaPapua New GuineaParaguayPeruPhilippinesPolandPortugalPost-demographic dividendPre-demographic dividendPuerto RicoQatarRomaniaRussian FederationRwandaSamoaSan MarinoSao Tome and PrincipeSaudi ArabiaSenegalSerbiaSeychellesSierra LeoneSingaporeSint Maarten (Dutch part)Slovak RepublicSloveniaSmall statesSolomon IslandsSomaliaSouth AfricaSouth AsiaSouth Asia (IDA & IBRD)South SudanSpainSri LankaSt. Kitts and NevisSt. LuciaSt. Martin (French part)St. Vincent and the GrenadinesSub-Saharan Africa Sub-Saharan Africa (excluding high income)Sub-Saharan Africa (IDA & IBRD countries)SudanSurinameSwazilandSwedenSwitzerlandSyrian Arab RepublicTajikistanTanzaniaThailandTimor-LesteTogoTongaTrinidad and TobagoTunisiaTurkeyTurkmenistanUgandaUkraineUnited Arab EmiratesUnited KingdomUnited StatesUpper middle incomeUruguayUzbekistanVanuatuVenezuela, RBVietnamVirgin Islands (U.S.)West Bank and GazaWorldYemen, Rep.ZambiaZimbabwe Timeline:
This timeline shows a graph from 1961 to 2015 of Malaysia. No data until 1960. Number of actual observations by date: 55.
Source name:
World Development Indicators
Source organization:
(1) United Nations Population Division. World Population Prospects, (2) Census reports and other statistical publications from national statistical offices, (3) Eurostat: Demographic Statistics, (4) United Nations Statistical Division. Population and Vital Statistics Reprot (various years), (5) U.S. Census Bureau: International Database, and (6) Secretariat of the Pacific Community: Statistics and Demography Programme.
Categories, topics:
Health, Gender, Social Development
Last updated:
apr 23, 2017
Indicators value changes by year
Minimum:
58.669
jan 1, 1961
At the date of observation
Value
Absolute change
Change from previous value
jan 1, 1961
58.669
+58.669
0.0%
jan 1, 1962
59.25
+0.581
0.99%
jan 1, 1963
59.804
+0.554
0.94%
jan 1, 1964
60.328
+0.524
0.88%
jan 1, 1965
60.823
+0.495
0.82%
jan 1, 1966
61.29
+0.467
0.77%
jan 1, 1967
61.731
+0.441
0.72%
jan 1, 1968
62.151
+0.42
0.68%
jan 1, 1969
62.557
+0.406
0.65%
jan 1, 1970
62.95
+0.393
0.63%
jan 1, 1971
63.332
+0.382
0.61%
jan 1, 1972
63.704
+0.372
0.59%
jan 1, 1973
64.064
+0.36
0.57%
jan 1, 1974
64.413
+0.349
0.54%
jan 1, 1975
64.75
+0.337
0.52%
jan 1, 1976
65.077
+0.327
0.51%
jan 1, 1977
65.393
+0.316
0.49%
jan 1, 1978
65.699
+0.306
0.47%
jan 1, 1979
65.995
+0.296
0.45%
jan 1, 1980
66.283
+0.288
0.44%
jan 1, 1981
66.562
+0.279
0.42%
jan 1, 1982
66.834
+0.272
0.41%
jan 1, 1983
67.098
+0.264
0.4%
jan 1, 1984
67.356
+0.258
0.38%
jan 1, 1985
67.607
+0.251
0.37%
jan 1, 1986
67.851
+0.244
0.36%
jan 1, 1987
68.089
+0.238
0.35%
jan 1, 1988
68.321
+0.232
0.34%
jan 1, 1989
68.545
+0.224
0.33%
jan 1, 1990
68.764
+0.219
0.32%
jan 1, 1991
68.977
+0.213
0.31%
jan 1, 1992
69.184
+0.207
0.3%
jan 1, 1993
69.386
+0.202
0.29%
jan 1, 1994
69.584
+0.198
0.29%
jan 1, 1995
69.777
+0.193
0.28%
jan 1, 1996
69.968
+0.191
0.27%
jan 1, 1997
70.157
+0.189
0.27%
jan 1, 1998
70.344
+0.187
0.27%
jan 1, 1999
70.528
+0.184
0.26%
jan 1, 2000
70.708
+0.18
0.26%
jan 1, 2001
70.879
+0.171
0.24%
jan 1, 2002
71.036
+0.157
0.22%
jan 1, 2003
71.177
+0.141
0.2%
jan 1, 2004
71.301
+0.124
0.17%
jan 1, 2005
71.41
+0.109
0.15%
jan 1, 2006
71.505
+0.095
0.13%
jan 1, 2007
71.589
+0.084
0.12%
jan 1, 2008
71.669
+0.08
0.11%
jan 1, 2009
71.749
+0.08
0.11%
jan 1, 2010
71.835
+0.086
0.12%
jan 1, 2011
71.929
+0.094
0.13%
jan 1, 2012
72.037
+0.108
0.15%
jan 1, 2013
72.156
+0.119
0.17%
jan 1, 2014
72.288
+0.132
0.18%
jan 1, 2015
72.43
+0.142
0.2%
Ranking of countries by current statistics by years


Comments: