29
/
en
AIzaSyAYiBZKx7MnpbEhh9jyipgxe19OcubqV5w
April 1, 2024
108724
Comoros
COM
true
2
1
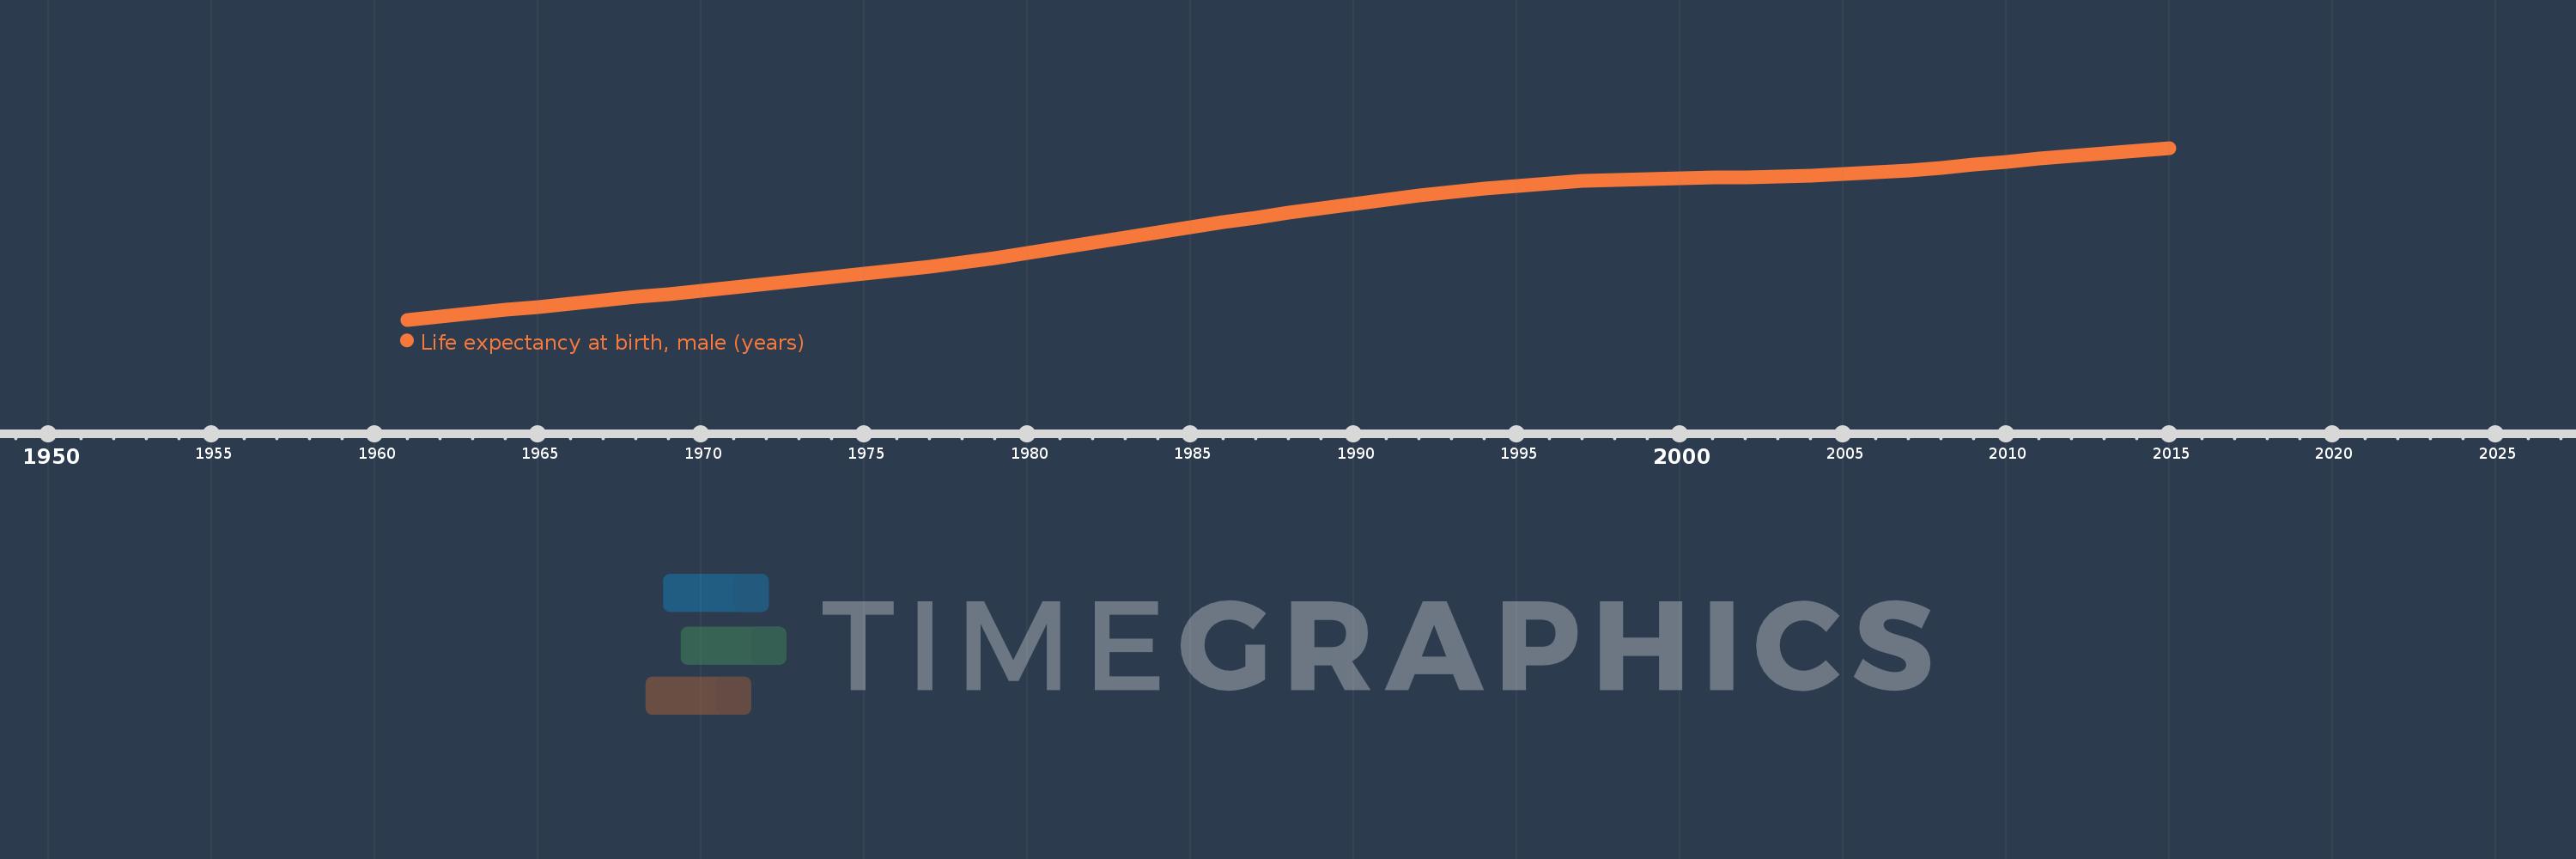
Life expectancy at birth, male (years)
2015,2014,2013,2012,2011,2010,2009,2008,2007,2006,2005,2004,2003,2002,2001,2000,1999,1998,1997,1996,1995,1994,1993,1992,1991,1990,1989,1988,1987,1986,1985,1984,1983,1982,1981,1980,1979,1978,1977,1976,1975,1974,1973,1972,1971,1970,1969,1968,1967,1966,1965,1964,1963,1962,1961
This statistics in other country:
AfghanistanAlbaniaAlgeriaAngolaAntigua and BarbudaArab WorldArgentinaArmeniaArubaAustraliaAustriaAzerbaijanBahamas, TheBahrainBangladeshBarbadosBelarusBelgiumBelizeBeninBermudaBhutanBoliviaBosnia and HerzegovinaBotswanaBrazilBrunei DarussalamBulgariaBurkina FasoBurundiCabo VerdeCambodiaCameroonCanadaCaribbean small statesCentral African RepublicCentral Europe and the BalticsChadChannel IslandsChileChinaColombiaComorosCongo, Dem. Rep.Congo, Rep.Costa RicaCote d'IvoireCroatiaCubaCuracaoCyprusCzech RepublicDenmarkDjiboutiDominicaDominican RepublicEarly-demographic dividendEast Asia & PacificEast Asia & Pacific (excluding high income)East Asia & Pacific (IDA & IBRD countries)EcuadorEgypt, Arab Rep.El SalvadorEquatorial GuineaEritreaEstoniaEthiopiaEuro areaEurope & Central AsiaEurope & Central Asia (excluding high income)Europe & Central Asia (IDA & IBRD countries)European UnionFaroe IslandsFijiFinlandFragile and conflict affected situationsFranceFrench PolynesiaGabonGambia, TheGeorgiaGermanyGhanaGreeceGreenlandGrenadaGuamGuatemalaGuineaGuinea-BissauGuyanaHaitiHeavily indebted poor countries (HIPC)High incomeHondurasHong Kong SAR, ChinaHungaryIBRD onlyIcelandIDA & IBRD totalIDA blendIDA onlyIDA totalIndiaIndonesiaIran, Islamic Rep.IraqIrelandIsle of ManIsraelItalyJamaicaJapanJordanKazakhstanKenyaKiribatiKorea, Dem. People’s Rep.Korea, Rep.KosovoKuwaitKyrgyz RepublicLao PDRLate-demographic dividendLatin America & Caribbean Latin America & Caribbean (excluding high income)Latin America & the Caribbean (IDA & IBRD countries)LatviaLeast developed countries: UN classificationLebanonLesothoLiberiaLibyaLiechtensteinLithuaniaLow & middle incomeLow incomeLower middle incomeLuxembourgMacao SAR, ChinaMacedonia, FYRMadagascarMalawiMalaysiaMaldivesMaliMaltaMarshall IslandsMauritaniaMauritiusMexicoMicronesia, Fed. Sts.Middle East & North AfricaMiddle East & North Africa (excluding high income)Middle East & North Africa (IDA & IBRD countries)Middle incomeMoldovaMongoliaMontenegroMoroccoMozambiqueMyanmarNamibiaNepalNetherlandsNew CaledoniaNew ZealandNicaraguaNigerNigeriaNorth AmericaNorwayOECD membersOmanOther small statesPacific island small statesPakistanPalauPanamaPapua New GuineaParaguayPeruPhilippinesPolandPortugalPost-demographic dividendPre-demographic dividendPuerto RicoQatarRomaniaRussian FederationRwandaSamoaSan MarinoSao Tome and PrincipeSaudi ArabiaSenegalSerbiaSeychellesSierra LeoneSingaporeSint Maarten (Dutch part)Slovak RepublicSloveniaSmall statesSolomon IslandsSomaliaSouth AfricaSouth AsiaSouth Asia (IDA & IBRD)South SudanSpainSri LankaSt. Kitts and NevisSt. LuciaSt. Martin (French part)St. Vincent and the GrenadinesSub-Saharan Africa Sub-Saharan Africa (excluding high income)Sub-Saharan Africa (IDA & IBRD countries)SudanSurinameSwazilandSwedenSwitzerlandSyrian Arab RepublicTajikistanTanzaniaThailandTimor-LesteTogoTongaTrinidad and TobagoTunisiaTurkeyTurkmenistanUgandaUkraineUnited Arab EmiratesUnited KingdomUnited StatesUpper middle incomeUruguayUzbekistanVanuatuVenezuela, RBVietnamVirgin Islands (U.S.)West Bank and GazaWorldYemen, Rep.ZambiaZimbabwe Timeline:
This timeline shows a graph from 1961 to 2015 of Comoros. No data until 1960. Number of actual observations by date: 55.
Source name:
World Development Indicators
Source organization:
(1) United Nations Population Division. World Population Prospects, (2) Census reports and other statistical publications from national statistical offices, (3) Eurostat: Demographic Statistics, (4) United Nations Statistical Division. Population and Vital Statistics Reprot (various years), (5) U.S. Census Bureau: International Database, and (6) Secretariat of the Pacific Community: Statistics and Demography Programme.
Categories, topics:
Health, Gender, Social Development
Last updated:
apr 23, 2017
Indicators value changes by year
Maximum:
61.631
jan 1, 2015
At the date of observation
Value
Absolute change
Change from previous value
jan 1, 1961
39.96
+39.96
0.0%
jan 1, 1962
40.361
+0.401
1.0%
jan 1, 1963
40.768
+0.407
1.01%
jan 1, 1964
41.175
+0.407
1.0%
jan 1, 1965
41.581
+0.406
0.99%
jan 1, 1966
41.985
+0.404
0.97%
jan 1, 1967
42.39
+0.405
0.96%
jan 1, 1968
42.799
+0.409
0.96%
jan 1, 1969
43.214
+0.415
0.97%
jan 1, 1970
43.637
+0.423
0.98%
jan 1, 1971
44.063
+0.426
0.98%
jan 1, 1972
44.488
+0.425
0.96%
jan 1, 1973
44.911
+0.423
0.95%
jan 1, 1974
45.333
+0.422
0.94%
jan 1, 1975
45.76
+0.427
0.94%
jan 1, 1976
46.204
+0.444
0.97%
jan 1, 1977
46.68
+0.476
1.03%
jan 1, 1978
47.197
+0.517
1.11%
jan 1, 1979
47.757
+0.56
1.19%
jan 1, 1980
48.359
+0.602
1.26%
jan 1, 1981
48.996
+0.637
1.32%
jan 1, 1982
49.658
+0.662
1.35%
jan 1, 1983
50.328
+0.67
1.35%
jan 1, 1984
50.992
+0.664
1.32%
jan 1, 1985
51.64
+0.648
1.27%
jan 1, 1986
52.267
+0.627
1.21%
jan 1, 1987
52.874
+0.607
1.16%
jan 1, 1988
53.464
+0.59
1.12%
jan 1, 1989
54.038
+0.574
1.07%
jan 1, 1990
54.591
+0.553
1.02%
jan 1, 1991
55.118
+0.527
0.97%
jan 1, 1992
55.614
+0.496
0.9%
jan 1, 1993
56.073
+0.459
0.83%
jan 1, 1994
56.492
+0.419
0.75%
jan 1, 1995
56.866
+0.374
0.66%
jan 1, 1996
57.184
+0.318
0.56%
jan 1, 1997
57.434
+0.25
0.44%
jan 1, 1998
57.619
+0.185
0.32%
jan 1, 1999
57.748
+0.129
0.22%
jan 1, 2000
57.833
+0.085
0.15%
jan 1, 2001
57.895
+0.062
0.11%
jan 1, 2002
57.956
+0.061
0.11%
jan 1, 2003
58.036
+0.08
0.14%
jan 1, 2004
58.153
+0.117
0.2%
jan 1, 2005
58.319
+0.166
0.29%
jan 1, 2006
58.541
+0.222
0.38%
jan 1, 2007
58.821
+0.28
0.48%
jan 1, 2008
59.146
+0.325
0.55%
jan 1, 2009
59.499
+0.353
0.6%
jan 1, 2010
59.872
+0.373
0.63%
jan 1, 2011
60.251
+0.379
0.63%
jan 1, 2012
60.623
+0.372
0.62%
jan 1, 2013
60.982
+0.359
0.59%
jan 1, 2014
61.319
+0.337
0.55%
jan 1, 2015
61.631
+0.312
0.51%
Ranking of countries by current statistics by years


Comments: