29
/
en
AIzaSyAYiBZKx7MnpbEhh9jyipgxe19OcubqV5w
April 1, 2024
71380
Armenia
ARM
true
2
1
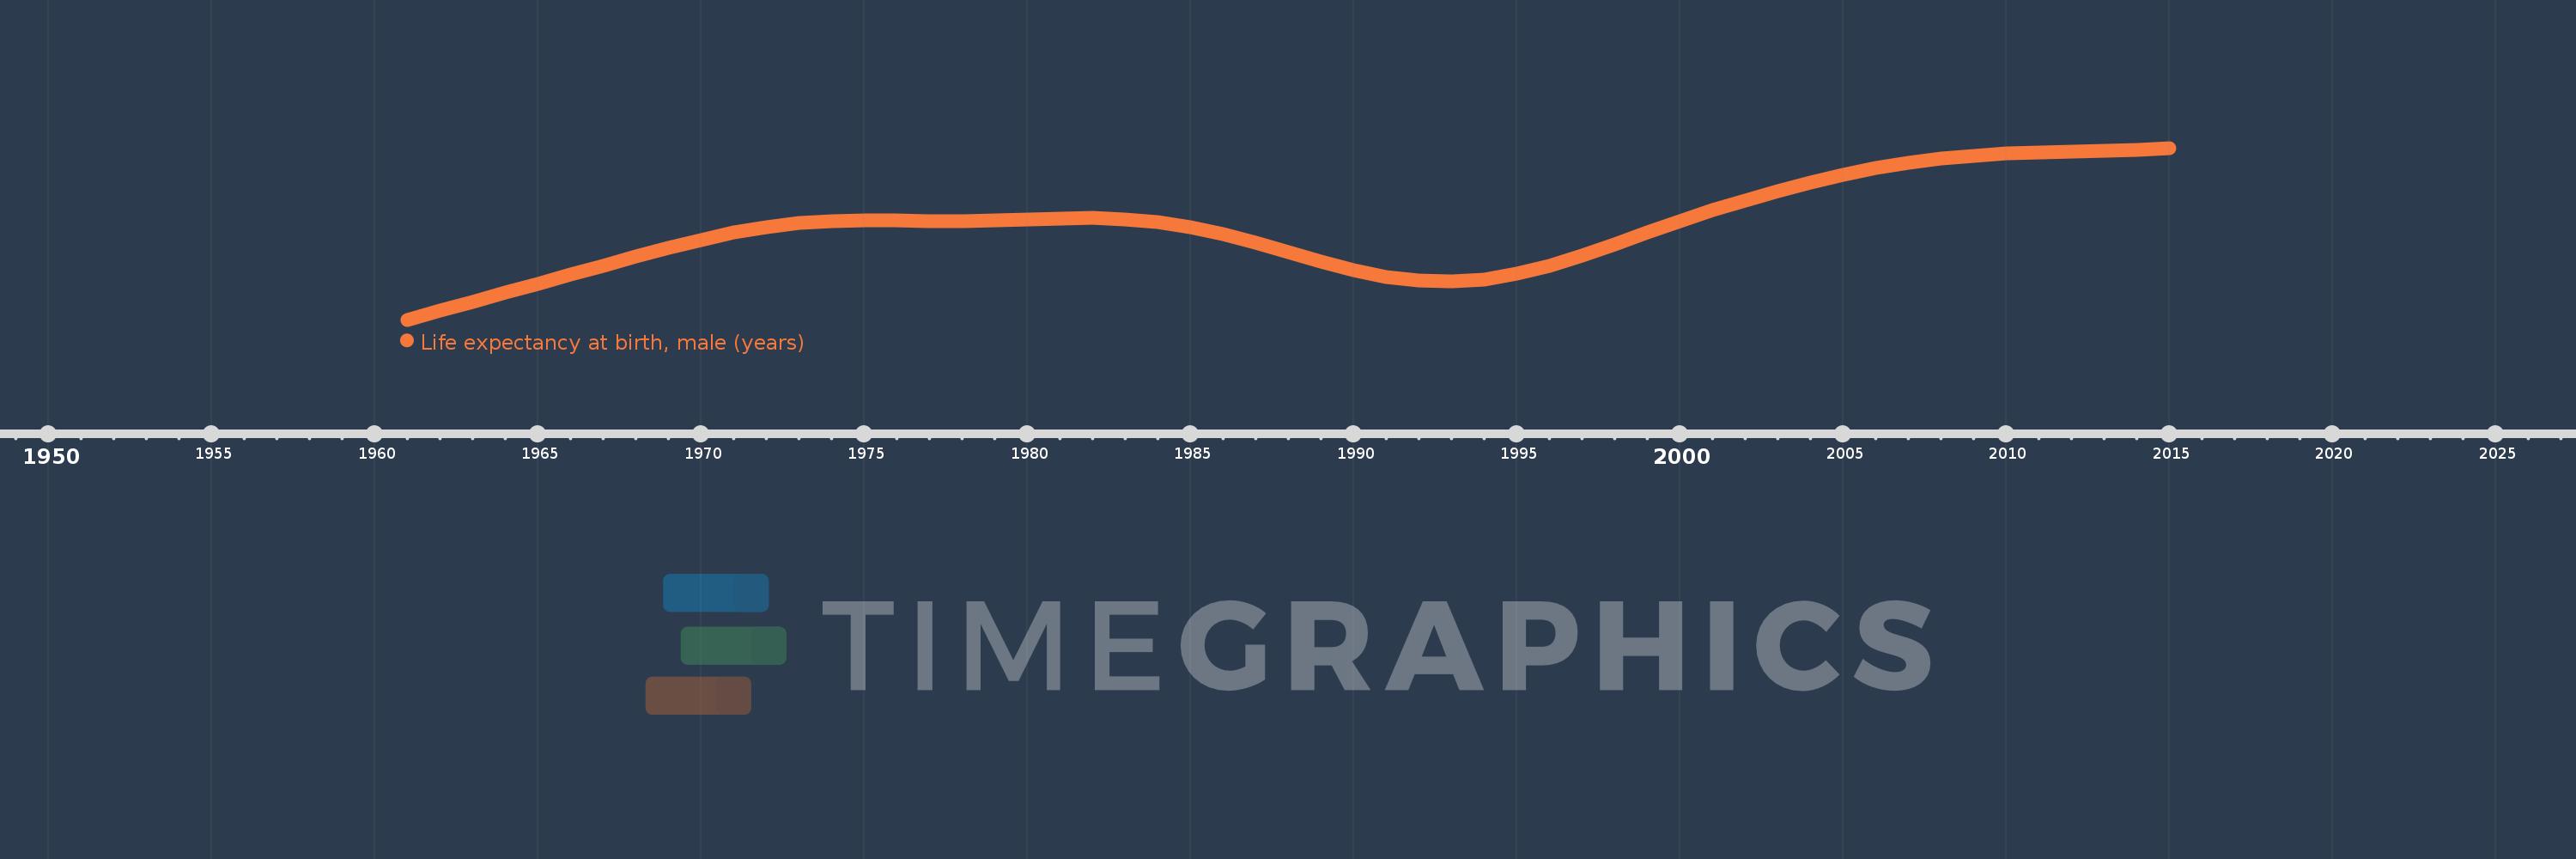
Life expectancy at birth, male (years)
2015,2014,2013,2012,2011,2010,2009,2008,2007,2006,2005,2004,2003,2002,2001,2000,1999,1998,1997,1996,1995,1994,1993,1992,1991,1990,1989,1988,1987,1986,1985,1984,1983,1982,1981,1980,1979,1978,1977,1976,1975,1974,1973,1972,1971,1970,1969,1968,1967,1966,1965,1964,1963,1962,1961
This statistics in other country:
AfghanistanAlbaniaAlgeriaAngolaAntigua and BarbudaArab WorldArgentinaArmeniaArubaAustraliaAustriaAzerbaijanBahamas, TheBahrainBangladeshBarbadosBelarusBelgiumBelizeBeninBermudaBhutanBoliviaBosnia and HerzegovinaBotswanaBrazilBrunei DarussalamBulgariaBurkina FasoBurundiCabo VerdeCambodiaCameroonCanadaCaribbean small statesCentral African RepublicCentral Europe and the BalticsChadChannel IslandsChileChinaColombiaComorosCongo, Dem. Rep.Congo, Rep.Costa RicaCote d'IvoireCroatiaCubaCuracaoCyprusCzech RepublicDenmarkDjiboutiDominicaDominican RepublicEarly-demographic dividendEast Asia & PacificEast Asia & Pacific (excluding high income)East Asia & Pacific (IDA & IBRD countries)EcuadorEgypt, Arab Rep.El SalvadorEquatorial GuineaEritreaEstoniaEthiopiaEuro areaEurope & Central AsiaEurope & Central Asia (excluding high income)Europe & Central Asia (IDA & IBRD countries)European UnionFaroe IslandsFijiFinlandFragile and conflict affected situationsFranceFrench PolynesiaGabonGambia, TheGeorgiaGermanyGhanaGreeceGreenlandGrenadaGuamGuatemalaGuineaGuinea-BissauGuyanaHaitiHeavily indebted poor countries (HIPC)High incomeHondurasHong Kong SAR, ChinaHungaryIBRD onlyIcelandIDA & IBRD totalIDA blendIDA onlyIDA totalIndiaIndonesiaIran, Islamic Rep.IraqIrelandIsle of ManIsraelItalyJamaicaJapanJordanKazakhstanKenyaKiribatiKorea, Dem. People’s Rep.Korea, Rep.KosovoKuwaitKyrgyz RepublicLao PDRLate-demographic dividendLatin America & Caribbean Latin America & Caribbean (excluding high income)Latin America & the Caribbean (IDA & IBRD countries)LatviaLeast developed countries: UN classificationLebanonLesothoLiberiaLibyaLiechtensteinLithuaniaLow & middle incomeLow incomeLower middle incomeLuxembourgMacao SAR, ChinaMacedonia, FYRMadagascarMalawiMalaysiaMaldivesMaliMaltaMarshall IslandsMauritaniaMauritiusMexicoMicronesia, Fed. Sts.Middle East & North AfricaMiddle East & North Africa (excluding high income)Middle East & North Africa (IDA & IBRD countries)Middle incomeMoldovaMongoliaMontenegroMoroccoMozambiqueMyanmarNamibiaNepalNetherlandsNew CaledoniaNew ZealandNicaraguaNigerNigeriaNorth AmericaNorwayOECD membersOmanOther small statesPacific island small statesPakistanPalauPanamaPapua New GuineaParaguayPeruPhilippinesPolandPortugalPost-demographic dividendPre-demographic dividendPuerto RicoQatarRomaniaRussian FederationRwandaSamoaSan MarinoSao Tome and PrincipeSaudi ArabiaSenegalSerbiaSeychellesSierra LeoneSingaporeSint Maarten (Dutch part)Slovak RepublicSloveniaSmall statesSolomon IslandsSomaliaSouth AfricaSouth AsiaSouth Asia (IDA & IBRD)South SudanSpainSri LankaSt. Kitts and NevisSt. LuciaSt. Martin (French part)St. Vincent and the GrenadinesSub-Saharan Africa Sub-Saharan Africa (excluding high income)Sub-Saharan Africa (IDA & IBRD countries)SudanSurinameSwazilandSwedenSwitzerlandSyrian Arab RepublicTajikistanTanzaniaThailandTimor-LesteTogoTongaTrinidad and TobagoTunisiaTurkeyTurkmenistanUgandaUkraineUnited Arab EmiratesUnited KingdomUnited StatesUpper middle incomeUruguayUzbekistanVanuatuVenezuela, RBVietnamVirgin Islands (U.S.)West Bank and GazaWorldYemen, Rep.ZambiaZimbabwe Timeline:
This timeline shows a graph from 1961 to 2015 of Armenia. No data until 1960. Number of actual observations by date: 55.
Source name:
World Development Indicators
Source organization:
(1) United Nations Population Division. World Population Prospects, (2) Census reports and other statistical publications from national statistical offices, (3) Eurostat: Demographic Statistics, (4) United Nations Statistical Division. Population and Vital Statistics Reprot (various years), (5) U.S. Census Bureau: International Database, and (6) Secretariat of the Pacific Community: Statistics and Demography Programme.
Categories, topics:
Health, Gender, Social Development
Last updated:
apr 23, 2017
Indicators value changes by year
Minimum:
62.822
jan 1, 1961
Maximum:
70.944
jan 1, 2015
At the date of observation
Value
Absolute change
Change from previous value
jan 1, 1961
62.822
+62.822
0.0%
jan 1, 1962
63.24
+0.418
0.67%
jan 1, 1963
63.664
+0.424
0.67%
jan 1, 1964
64.092
+0.428
0.67%
jan 1, 1965
64.522
+0.43
0.67%
jan 1, 1966
64.953
+0.431
0.67%
jan 1, 1967
65.384
+0.431
0.66%
jan 1, 1968
65.81
+0.426
0.65%
jan 1, 1969
66.22
+0.41
0.62%
jan 1, 1970
66.602
+0.382
0.58%
jan 1, 1971
66.935
+0.333
0.5%
jan 1, 1972
67.198
+0.263
0.39%
jan 1, 1973
67.381
+0.183
0.27%
jan 1, 1974
67.486
+0.105
0.16%
jan 1, 1975
67.52
+0.034
0.05%
jan 1, 1976
67.509
-0.011
-0.02%
jan 1, 1977
67.486
-0.023
-0.03%
jan 1, 1978
67.479
-0.007
-0.01%
jan 1, 1979
67.502
+0.023
0.03%
jan 1, 1980
67.552
+0.05
0.07%
jan 1, 1981
67.606
+0.054
0.08%
jan 1, 1982
67.626
+0.02
0.03%
jan 1, 1983
67.576
-0.05
-0.07%
jan 1, 1984
67.436
-0.14
-0.21%
jan 1, 1985
67.203
-0.233
-0.35%
jan 1, 1986
66.88
-0.323
-0.48%
jan 1, 1987
66.476
-0.404
-0.6%
jan 1, 1988
66.03
-0.446
-0.67%
jan 1, 1989
65.586
-0.444
-0.67%
jan 1, 1990
65.18
-0.406
-0.62%
jan 1, 1991
64.86
-0.32
-0.49%
jan 1, 1992
64.67
-0.19
-0.29%
jan 1, 1993
64.627
-0.043
-0.07%
jan 1, 1994
64.732
+0.105
0.16%
jan 1, 1995
64.983
+0.251
0.39%
jan 1, 1996
65.366
+0.383
0.59%
jan 1, 1997
65.851
+0.485
0.74%
jan 1, 1998
66.393
+0.542
0.82%
jan 1, 1999
66.949
+0.556
0.84%
jan 1, 2000
67.491
+0.542
0.81%
jan 1, 2001
68.0
+0.509
0.75%
jan 1, 2002
68.469
+0.469
0.69%
jan 1, 2003
68.906
+0.437
0.64%
jan 1, 2004
69.313
+0.407
0.59%
jan 1, 2005
69.684
+0.371
0.54%
jan 1, 2006
70.003
+0.319
0.46%
jan 1, 2007
70.259
+0.256
0.37%
jan 1, 2008
70.451
+0.192
0.27%
jan 1, 2009
70.585
+0.134
0.19%
jan 1, 2010
70.669
+0.084
0.12%
jan 1, 2011
70.72
+0.051
0.07%
jan 1, 2012
70.756
+0.036
0.05%
jan 1, 2013
70.796
+0.04
0.06%
jan 1, 2014
70.856
+0.06
0.08%
jan 1, 2015
70.944
+0.088
0.12%
Ranking of countries by current statistics by years


Comments: