29
/
en
AIzaSyAYiBZKx7MnpbEhh9jyipgxe19OcubqV5w
April 1, 2024
47304
Lower middle income
LMC
false
2
1
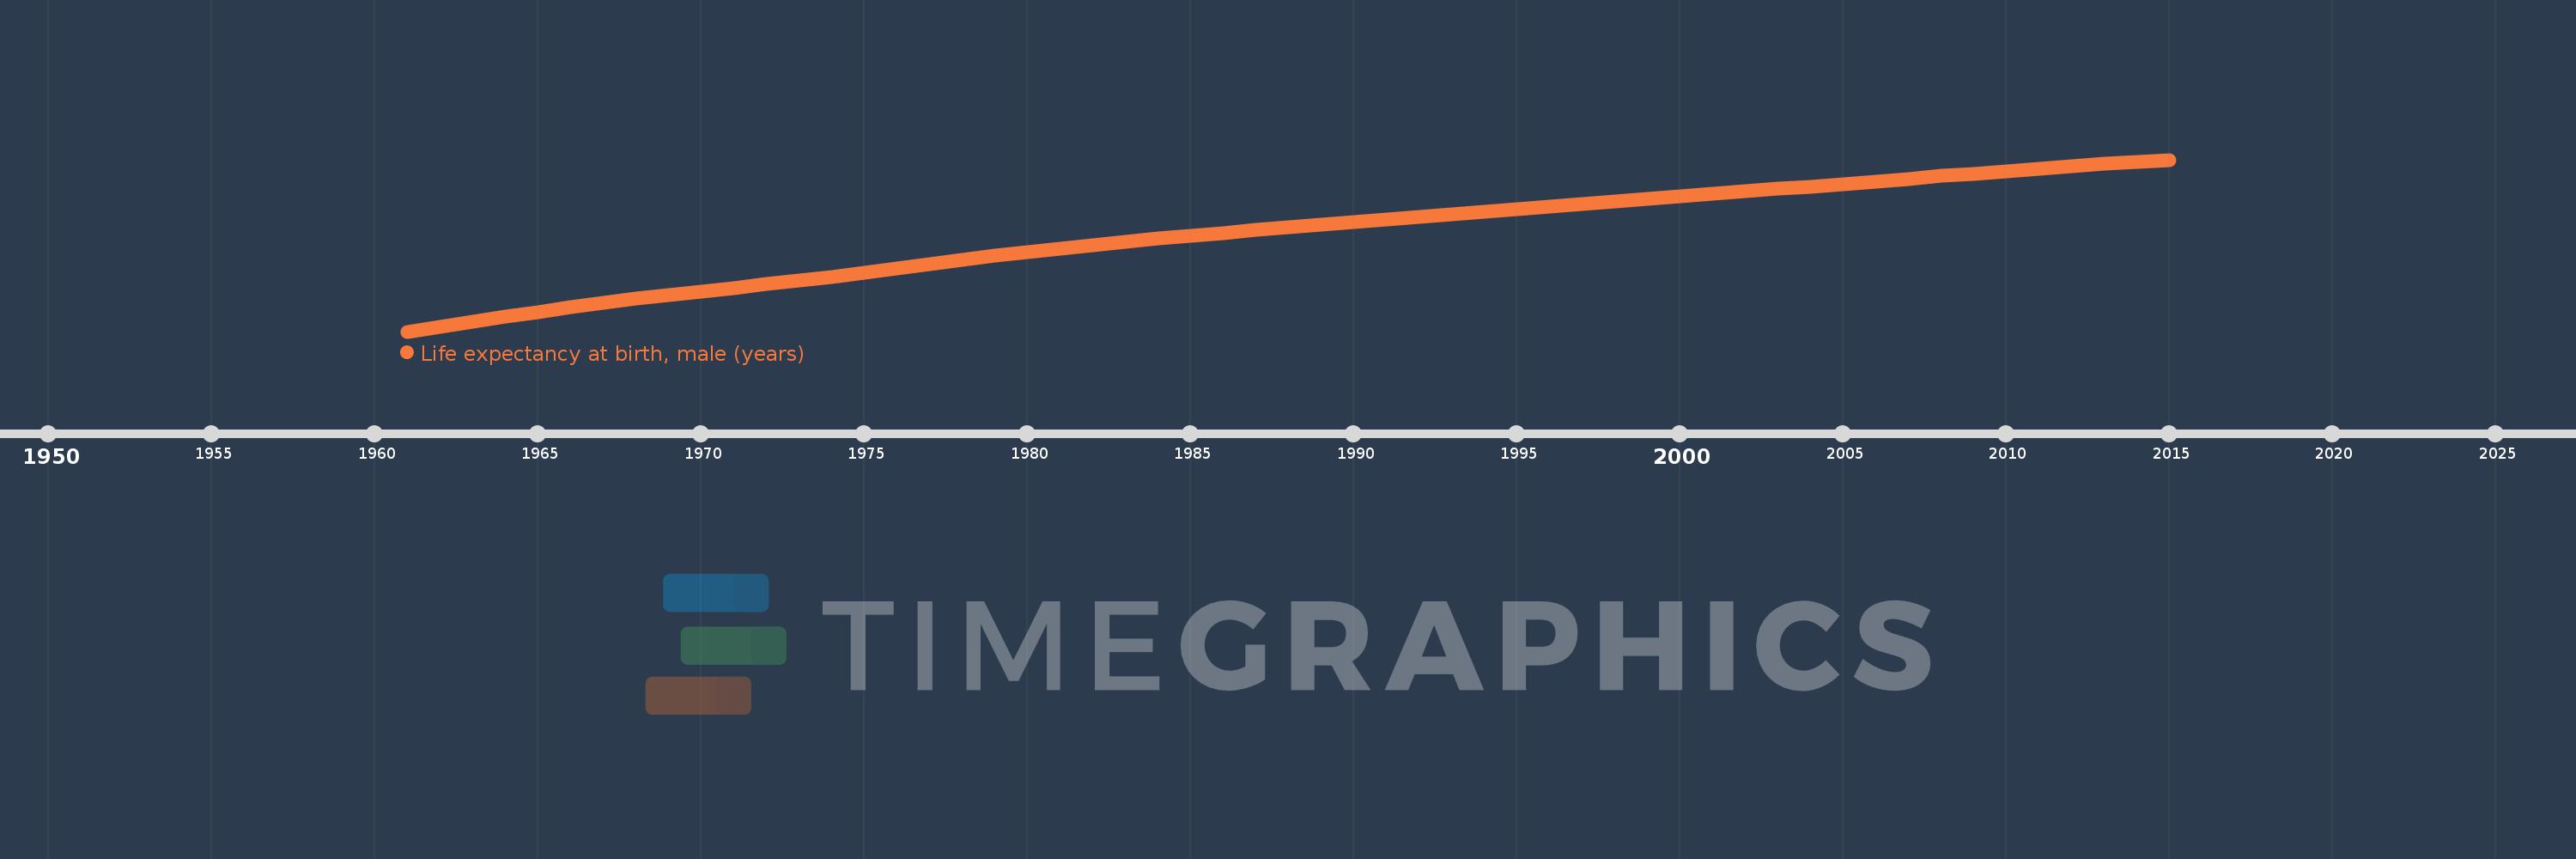
Life expectancy at birth, male (years)
2015,2014,2013,2012,2011,2010,2009,2008,2007,2006,2005,2004,2003,2002,2001,2000,1999,1998,1997,1996,1995,1994,1993,1992,1991,1990,1989,1988,1987,1986,1985,1984,1983,1982,1981,1980,1979,1978,1977,1976,1975,1974,1973,1972,1971,1970,1969,1968,1967,1966,1965,1964,1963,1962,1961
This statistics in other country:
AfghanistanAlbaniaAlgeriaAngolaAntigua and BarbudaArab WorldArgentinaArmeniaArubaAustraliaAustriaAzerbaijanBahamas, TheBahrainBangladeshBarbadosBelarusBelgiumBelizeBeninBermudaBhutanBoliviaBosnia and HerzegovinaBotswanaBrazilBrunei DarussalamBulgariaBurkina FasoBurundiCabo VerdeCambodiaCameroonCanadaCaribbean small statesCentral African RepublicCentral Europe and the BalticsChadChannel IslandsChileChinaColombiaComorosCongo, Dem. Rep.Congo, Rep.Costa RicaCote d'IvoireCroatiaCubaCuracaoCyprusCzech RepublicDenmarkDjiboutiDominicaDominican RepublicEarly-demographic dividendEast Asia & PacificEast Asia & Pacific (excluding high income)East Asia & Pacific (IDA & IBRD countries)EcuadorEgypt, Arab Rep.El SalvadorEquatorial GuineaEritreaEstoniaEthiopiaEuro areaEurope & Central AsiaEurope & Central Asia (excluding high income)Europe & Central Asia (IDA & IBRD countries)European UnionFaroe IslandsFijiFinlandFragile and conflict affected situationsFranceFrench PolynesiaGabonGambia, TheGeorgiaGermanyGhanaGreeceGreenlandGrenadaGuamGuatemalaGuineaGuinea-BissauGuyanaHaitiHeavily indebted poor countries (HIPC)High incomeHondurasHong Kong SAR, ChinaHungaryIBRD onlyIcelandIDA & IBRD totalIDA blendIDA onlyIDA totalIndiaIndonesiaIran, Islamic Rep.IraqIrelandIsle of ManIsraelItalyJamaicaJapanJordanKazakhstanKenyaKiribatiKorea, Dem. People’s Rep.Korea, Rep.KosovoKuwaitKyrgyz RepublicLao PDRLate-demographic dividendLatin America & Caribbean Latin America & Caribbean (excluding high income)Latin America & the Caribbean (IDA & IBRD countries)LatviaLeast developed countries: UN classificationLebanonLesothoLiberiaLibyaLiechtensteinLithuaniaLow & middle incomeLow incomeLower middle incomeLuxembourgMacao SAR, ChinaMacedonia, FYRMadagascarMalawiMalaysiaMaldivesMaliMaltaMarshall IslandsMauritaniaMauritiusMexicoMicronesia, Fed. Sts.Middle East & North AfricaMiddle East & North Africa (excluding high income)Middle East & North Africa (IDA & IBRD countries)Middle incomeMoldovaMongoliaMontenegroMoroccoMozambiqueMyanmarNamibiaNepalNetherlandsNew CaledoniaNew ZealandNicaraguaNigerNigeriaNorth AmericaNorwayOECD membersOmanOther small statesPacific island small statesPakistanPalauPanamaPapua New GuineaParaguayPeruPhilippinesPolandPortugalPost-demographic dividendPre-demographic dividendPuerto RicoQatarRomaniaRussian FederationRwandaSamoaSan MarinoSao Tome and PrincipeSaudi ArabiaSenegalSerbiaSeychellesSierra LeoneSingaporeSint Maarten (Dutch part)Slovak RepublicSloveniaSmall statesSolomon IslandsSomaliaSouth AfricaSouth AsiaSouth Asia (IDA & IBRD)South SudanSpainSri LankaSt. Kitts and NevisSt. LuciaSt. Martin (French part)St. Vincent and the GrenadinesSub-Saharan Africa Sub-Saharan Africa (excluding high income)Sub-Saharan Africa (IDA & IBRD countries)SudanSurinameSwazilandSwedenSwitzerlandSyrian Arab RepublicTajikistanTanzaniaThailandTimor-LesteTogoTongaTrinidad and TobagoTunisiaTurkeyTurkmenistanUgandaUkraineUnited Arab EmiratesUnited KingdomUnited StatesUpper middle incomeUruguayUzbekistanVanuatuVenezuela, RBVietnamVirgin Islands (U.S.)West Bank and GazaWorldYemen, Rep.ZambiaZimbabwe Timeline:
This timeline shows a graph from 1961 to 2015 of Lower middle income. No data until 1960. Number of actual observations by date: 55.
Source name:
World Development Indicators
Source organization:
(1) United Nations Population Division. World Population Prospects, (2) Census reports and other statistical publications from national statistical offices, (3) Eurostat: Demographic Statistics, (4) United Nations Statistical Division. Population and Vital Statistics Reprot (various years), (5) U.S. Census Bureau: International Database, and (6) Secretariat of the Pacific Community: Statistics and Demography Programme.
Categories, topics:
Health, Gender, Social Development
Last updated:
apr 23, 2017
Indicators value changes by year
Maximum:
65.529
jan 1, 2015
At the date of observation
Value
Absolute change
Change from previous value
jan 1, 1961
44.96
+44.96
0.0%
jan 1, 1962
45.557
+0.598
1.33%
jan 1, 1963
46.148
+0.59
1.3%
jan 1, 1964
46.729
+0.581
1.26%
jan 1, 1965
47.302
+0.574
1.23%
jan 1, 1966
47.858
+0.556
1.17%
jan 1, 1967
48.387
+0.529
1.11%
jan 1, 1968
48.883
+0.496
1.03%
jan 1, 1969
49.347
+0.464
0.95%
jan 1, 1970
49.783
+0.436
0.88%
jan 1, 1971
50.203
+0.42
0.84%
jan 1, 1972
50.622
+0.419
0.83%
jan 1, 1973
51.055
+0.432
0.85%
jan 1, 1974
51.509
+0.455
0.89%
jan 1, 1975
51.987
+0.478
0.93%
jan 1, 1976
52.486
+0.499
0.96%
jan 1, 1977
52.999
+0.514
0.98%
jan 1, 1978
53.513
+0.514
0.97%
jan 1, 1979
54.012
+0.499
0.93%
jan 1, 1980
54.488
+0.475
0.88%
jan 1, 1981
54.931
+0.444
0.81%
jan 1, 1982
55.341
+0.41
0.75%
jan 1, 1983
55.726
+0.385
0.7%
jan 1, 1984
56.093
+0.367
0.66%
jan 1, 1985
56.444
+0.351
0.63%
jan 1, 1986
56.784
+0.339
0.6%
jan 1, 1987
57.113
+0.33
0.58%
jan 1, 1988
57.453
+0.339
0.59%
jan 1, 1989
57.771
+0.319
0.55%
jan 1, 1990
58.085
+0.314
0.54%
jan 1, 1991
58.408
+0.323
0.56%
jan 1, 1992
58.691
+0.283
0.48%
jan 1, 1993
59.018
+0.326
0.56%
jan 1, 1994
59.317
+0.3
0.51%
jan 1, 1995
59.617
+0.3
0.51%
jan 1, 1996
59.912
+0.295
0.49%
jan 1, 1997
60.216
+0.304
0.51%
jan 1, 1998
60.534
+0.318
0.53%
jan 1, 1999
60.852
+0.318
0.53%
jan 1, 2000
61.156
+0.304
0.5%
jan 1, 2001
61.438
+0.282
0.46%
jan 1, 2002
61.739
+0.301
0.49%
jan 1, 2003
62.035
+0.296
0.48%
jan 1, 2004
62.339
+0.303
0.49%
jan 1, 2005
62.647
+0.308
0.49%
jan 1, 2006
62.953
+0.306
0.49%
jan 1, 2007
63.266
+0.313
0.5%
jan 1, 2008
63.577
+0.311
0.49%
jan 1, 2009
63.878
+0.301
0.47%
jan 1, 2010
64.188
+0.31
0.49%
jan 1, 2011
64.491
+0.303
0.47%
jan 1, 2012
64.764
+0.274
0.42%
jan 1, 2013
65.024
+0.26
0.4%
jan 1, 2014
65.282
+0.257
0.4%
jan 1, 2015
65.529
+0.247
0.38%
Ranking of countries by current statistics by years


Comments: