29
/
en
AIzaSyAYiBZKx7MnpbEhh9jyipgxe19OcubqV5w
April 1, 2024
204297
Myanmar
MMR
true
2
1
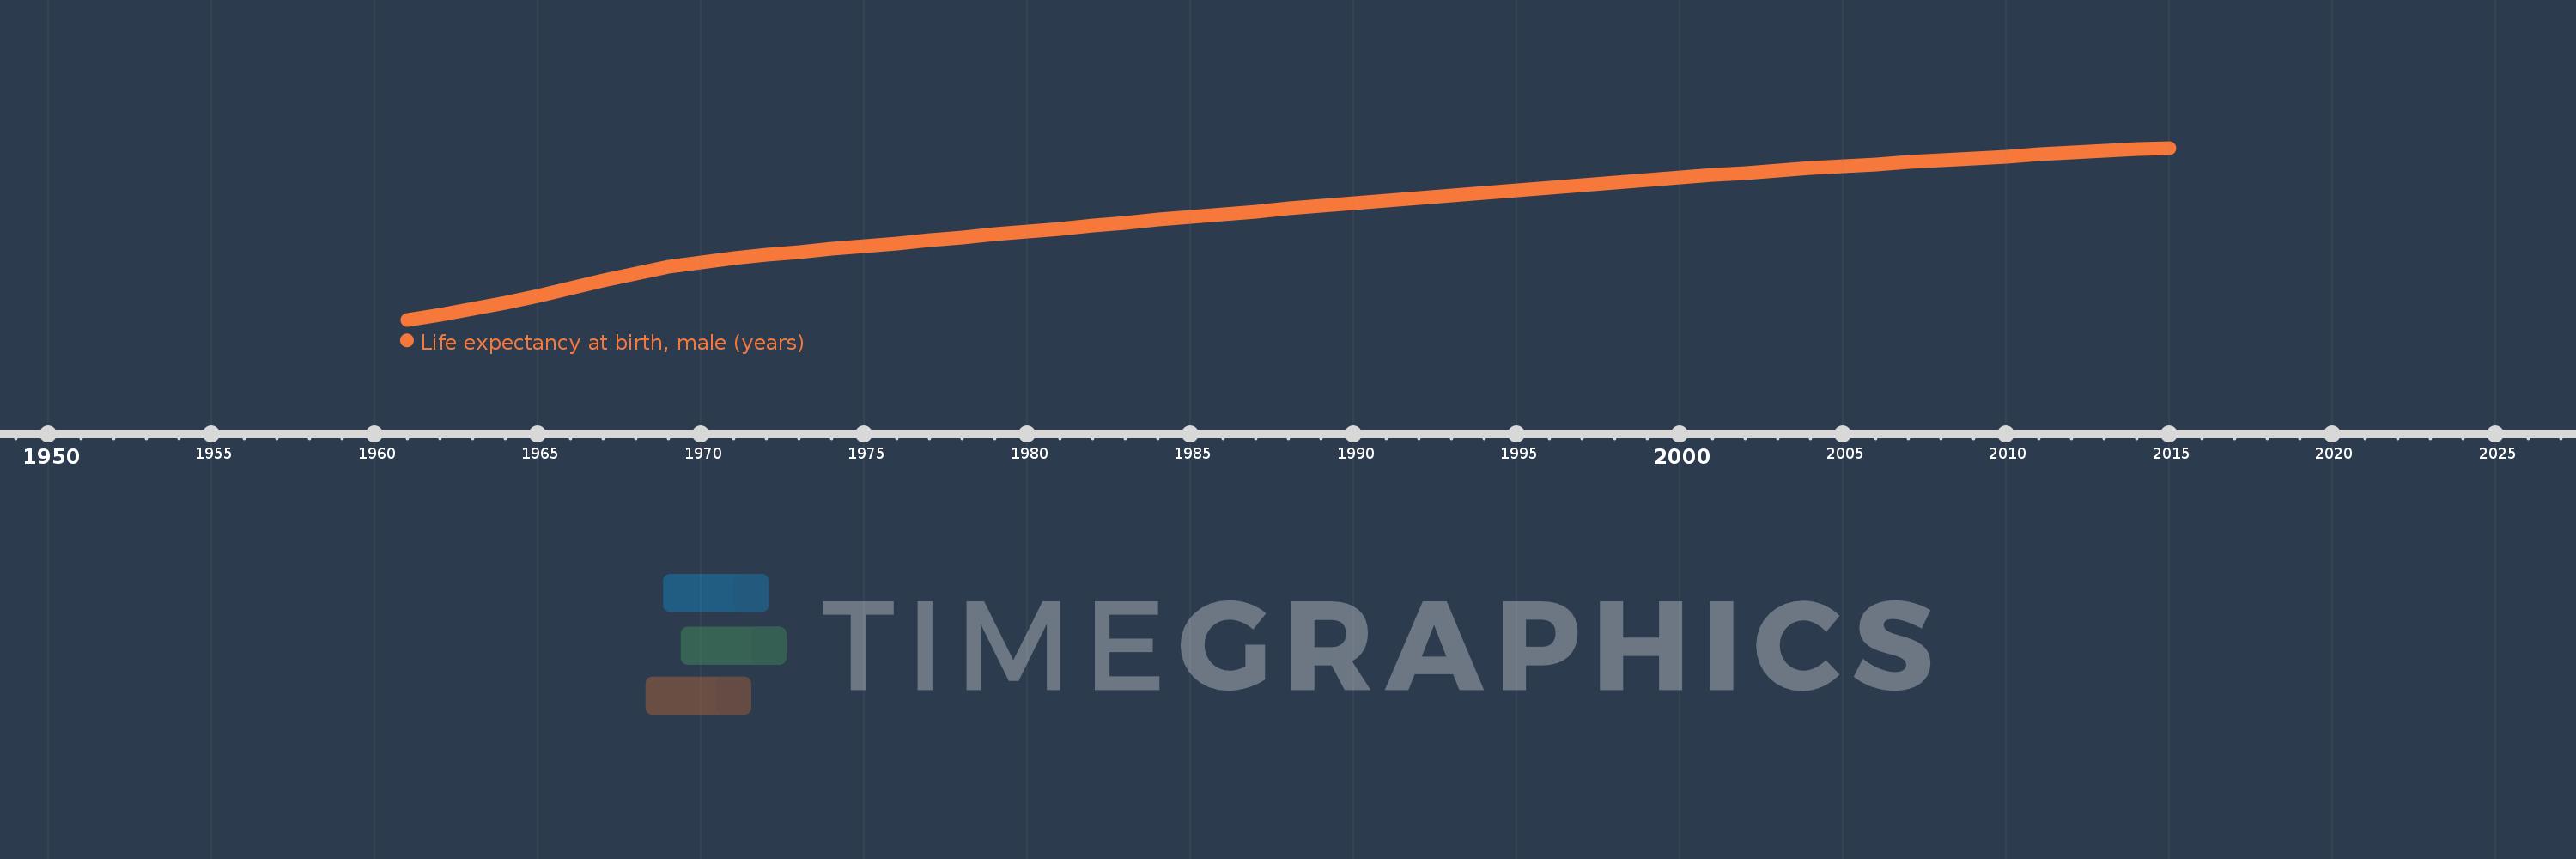
Life expectancy at birth, male (years)
2015,2014,2013,2012,2011,2010,2009,2008,2007,2006,2005,2004,2003,2002,2001,2000,1999,1998,1997,1996,1995,1994,1993,1992,1991,1990,1989,1988,1987,1986,1985,1984,1983,1982,1981,1980,1979,1978,1977,1976,1975,1974,1973,1972,1971,1970,1969,1968,1967,1966,1965,1964,1963,1962,1961
This statistics in other country:
AfghanistanAlbaniaAlgeriaAngolaAntigua and BarbudaArab WorldArgentinaArmeniaArubaAustraliaAustriaAzerbaijanBahamas, TheBahrainBangladeshBarbadosBelarusBelgiumBelizeBeninBermudaBhutanBoliviaBosnia and HerzegovinaBotswanaBrazilBrunei DarussalamBulgariaBurkina FasoBurundiCabo VerdeCambodiaCameroonCanadaCaribbean small statesCentral African RepublicCentral Europe and the BalticsChadChannel IslandsChileChinaColombiaComorosCongo, Dem. Rep.Congo, Rep.Costa RicaCote d'IvoireCroatiaCubaCuracaoCyprusCzech RepublicDenmarkDjiboutiDominicaDominican RepublicEarly-demographic dividendEast Asia & PacificEast Asia & Pacific (excluding high income)East Asia & Pacific (IDA & IBRD countries)EcuadorEgypt, Arab Rep.El SalvadorEquatorial GuineaEritreaEstoniaEthiopiaEuro areaEurope & Central AsiaEurope & Central Asia (excluding high income)Europe & Central Asia (IDA & IBRD countries)European UnionFaroe IslandsFijiFinlandFragile and conflict affected situationsFranceFrench PolynesiaGabonGambia, TheGeorgiaGermanyGhanaGreeceGreenlandGrenadaGuamGuatemalaGuineaGuinea-BissauGuyanaHaitiHeavily indebted poor countries (HIPC)High incomeHondurasHong Kong SAR, ChinaHungaryIBRD onlyIcelandIDA & IBRD totalIDA blendIDA onlyIDA totalIndiaIndonesiaIran, Islamic Rep.IraqIrelandIsle of ManIsraelItalyJamaicaJapanJordanKazakhstanKenyaKiribatiKorea, Dem. People’s Rep.Korea, Rep.KosovoKuwaitKyrgyz RepublicLao PDRLate-demographic dividendLatin America & Caribbean Latin America & Caribbean (excluding high income)Latin America & the Caribbean (IDA & IBRD countries)LatviaLeast developed countries: UN classificationLebanonLesothoLiberiaLibyaLiechtensteinLithuaniaLow & middle incomeLow incomeLower middle incomeLuxembourgMacao SAR, ChinaMacedonia, FYRMadagascarMalawiMalaysiaMaldivesMaliMaltaMarshall IslandsMauritaniaMauritiusMexicoMicronesia, Fed. Sts.Middle East & North AfricaMiddle East & North Africa (excluding high income)Middle East & North Africa (IDA & IBRD countries)Middle incomeMoldovaMongoliaMontenegroMoroccoMozambiqueMyanmarNamibiaNepalNetherlandsNew CaledoniaNew ZealandNicaraguaNigerNigeriaNorth AmericaNorwayOECD membersOmanOther small statesPacific island small statesPakistanPalauPanamaPapua New GuineaParaguayPeruPhilippinesPolandPortugalPost-demographic dividendPre-demographic dividendPuerto RicoQatarRomaniaRussian FederationRwandaSamoaSan MarinoSao Tome and PrincipeSaudi ArabiaSenegalSerbiaSeychellesSierra LeoneSingaporeSint Maarten (Dutch part)Slovak RepublicSloveniaSmall statesSolomon IslandsSomaliaSouth AfricaSouth AsiaSouth Asia (IDA & IBRD)South SudanSpainSri LankaSt. Kitts and NevisSt. LuciaSt. Martin (French part)St. Vincent and the GrenadinesSub-Saharan Africa Sub-Saharan Africa (excluding high income)Sub-Saharan Africa (IDA & IBRD countries)SudanSurinameSwazilandSwedenSwitzerlandSyrian Arab RepublicTajikistanTanzaniaThailandTimor-LesteTogoTongaTrinidad and TobagoTunisiaTurkeyTurkmenistanUgandaUkraineUnited Arab EmiratesUnited KingdomUnited StatesUpper middle incomeUruguayUzbekistanVanuatuVenezuela, RBVietnamVirgin Islands (U.S.)West Bank and GazaWorldYemen, Rep.ZambiaZimbabwe Timeline:
This timeline shows a graph from 1961 to 2015 of Myanmar. No data until 1960. Number of actual observations by date: 55.
Source name:
World Development Indicators
Source organization:
(1) United Nations Population Division. World Population Prospects, (2) Census reports and other statistical publications from national statistical offices, (3) Eurostat: Demographic Statistics, (4) United Nations Statistical Division. Population and Vital Statistics Reprot (various years), (5) U.S. Census Bureau: International Database, and (6) Secretariat of the Pacific Community: Statistics and Demography Programme.
Categories, topics:
Health, Gender, Social Development
Last updated:
apr 23, 2017
Indicators value changes by year
Minimum:
39.872
jan 1, 1961
Maximum:
63.852
jan 1, 2015
At the date of observation
Value
Absolute change
Change from previous value
jan 1, 1961
39.872
+39.872
0.0%
jan 1, 1962
40.564
+0.692
1.74%
jan 1, 1963
41.346
+0.782
1.93%
jan 1, 1964
42.24
+0.894
2.16%
jan 1, 1965
43.239
+0.999
2.37%
jan 1, 1966
44.302
+1.063
2.46%
jan 1, 1967
45.364
+1.062
2.4%
jan 1, 1968
46.351
+0.987
2.18%
jan 1, 1969
47.21
+0.859
1.85%
jan 1, 1970
47.924
+0.714
1.51%
jan 1, 1971
48.495
+0.571
1.19%
jan 1, 1972
48.952
+0.457
0.94%
jan 1, 1973
49.348
+0.396
0.81%
jan 1, 1974
49.728
+0.38
0.77%
jan 1, 1975
50.112
+0.384
0.77%
jan 1, 1976
50.513
+0.401
0.8%
jan 1, 1977
50.932
+0.419
0.83%
jan 1, 1978
51.356
+0.424
0.83%
jan 1, 1979
51.775
+0.419
0.82%
jan 1, 1980
52.191
+0.416
0.8%
jan 1, 1981
52.602
+0.411
0.79%
jan 1, 1982
53.01
+0.408
0.78%
jan 1, 1983
53.414
+0.404
0.76%
jan 1, 1984
53.813
+0.399
0.75%
jan 1, 1985
54.209
+0.396
0.74%
jan 1, 1986
54.601
+0.392
0.72%
jan 1, 1987
54.989
+0.388
0.71%
jan 1, 1988
55.373
+0.384
0.7%
jan 1, 1989
55.754
+0.381
0.69%
jan 1, 1990
56.13
+0.376
0.67%
jan 1, 1991
56.501
+0.371
0.66%
jan 1, 1992
56.868
+0.367
0.65%
jan 1, 1993
57.229
+0.361
0.63%
jan 1, 1994
57.586
+0.357
0.62%
jan 1, 1995
57.939
+0.353
0.61%
jan 1, 1996
58.289
+0.35
0.6%
jan 1, 1997
58.642
+0.353
0.61%
jan 1, 1998
58.996
+0.354
0.6%
jan 1, 1999
59.352
+0.356
0.6%
jan 1, 2000
59.708
+0.356
0.6%
jan 1, 2001
60.058
+0.35
0.59%
jan 1, 2002
60.397
+0.339
0.56%
jan 1, 2003
60.72
+0.323
0.53%
jan 1, 2004
61.025
+0.305
0.5%
jan 1, 2005
61.312
+0.287
0.47%
jan 1, 2006
61.586
+0.274
0.45%
jan 1, 2007
61.854
+0.268
0.44%
jan 1, 2008
62.121
+0.267
0.43%
jan 1, 2009
62.392
+0.271
0.44%
jan 1, 2010
62.666
+0.274
0.44%
jan 1, 2011
62.937
+0.271
0.43%
jan 1, 2012
63.197
+0.26
0.41%
jan 1, 2013
63.439
+0.242
0.38%
jan 1, 2014
63.658
+0.219
0.35%
jan 1, 2015
63.852
+0.194
0.3%
Ranking of countries by current statistics by years


Comments: