29
/
en
AIzaSyAYiBZKx7MnpbEhh9jyipgxe19OcubqV5w
April 1, 2024
100146
Cameroon
CMR
true
2
1
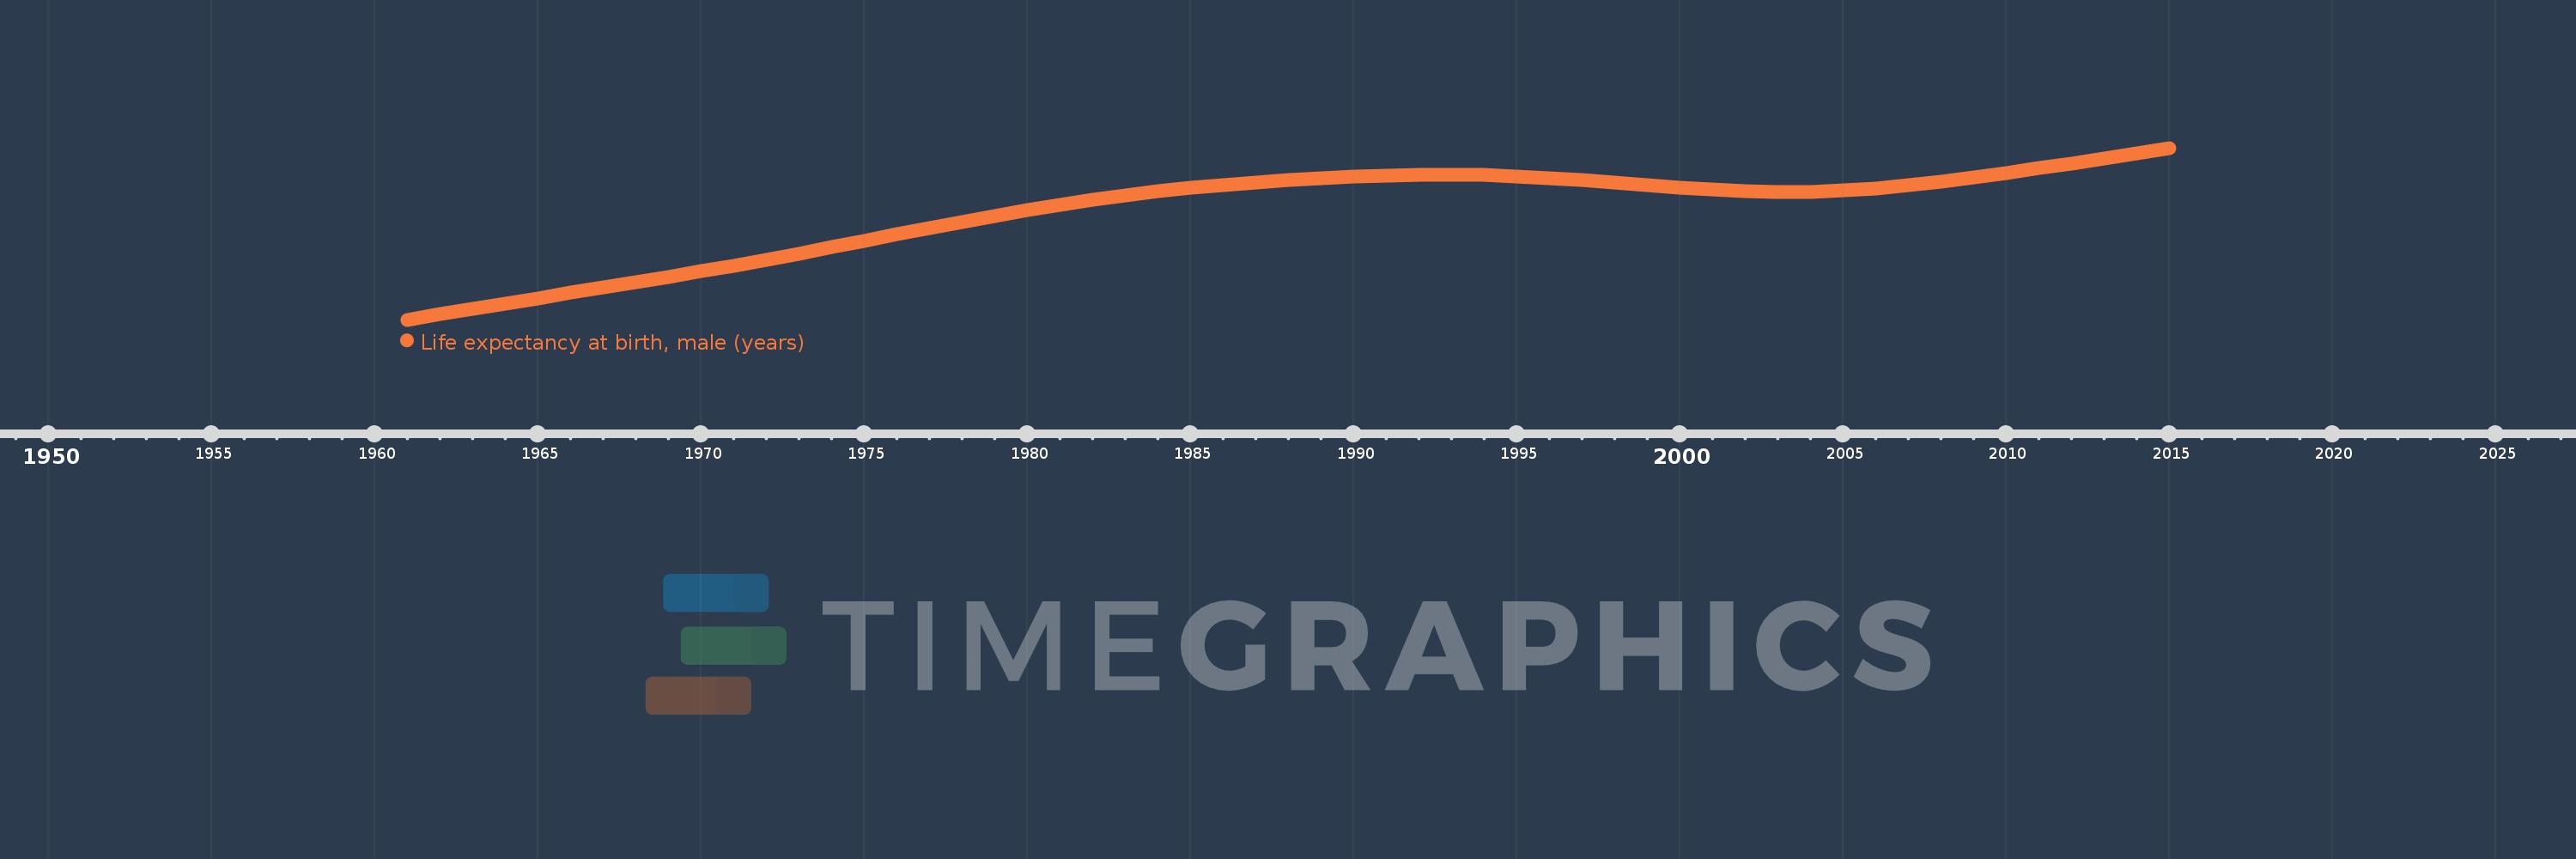
Life expectancy at birth, male (years)
2015,2014,2013,2012,2011,2010,2009,2008,2007,2006,2005,2004,2003,2002,2001,2000,1999,1998,1997,1996,1995,1994,1993,1992,1991,1990,1989,1988,1987,1986,1985,1984,1983,1982,1981,1980,1979,1978,1977,1976,1975,1974,1973,1972,1971,1970,1969,1968,1967,1966,1965,1964,1963,1962,1961
This statistics in other country:
AfghanistanAlbaniaAlgeriaAngolaAntigua and BarbudaArab WorldArgentinaArmeniaArubaAustraliaAustriaAzerbaijanBahamas, TheBahrainBangladeshBarbadosBelarusBelgiumBelizeBeninBermudaBhutanBoliviaBosnia and HerzegovinaBotswanaBrazilBrunei DarussalamBulgariaBurkina FasoBurundiCabo VerdeCambodiaCameroonCanadaCaribbean small statesCentral African RepublicCentral Europe and the BalticsChadChannel IslandsChileChinaColombiaComorosCongo, Dem. Rep.Congo, Rep.Costa RicaCote d'IvoireCroatiaCubaCuracaoCyprusCzech RepublicDenmarkDjiboutiDominicaDominican RepublicEarly-demographic dividendEast Asia & PacificEast Asia & Pacific (excluding high income)East Asia & Pacific (IDA & IBRD countries)EcuadorEgypt, Arab Rep.El SalvadorEquatorial GuineaEritreaEstoniaEthiopiaEuro areaEurope & Central AsiaEurope & Central Asia (excluding high income)Europe & Central Asia (IDA & IBRD countries)European UnionFaroe IslandsFijiFinlandFragile and conflict affected situationsFranceFrench PolynesiaGabonGambia, TheGeorgiaGermanyGhanaGreeceGreenlandGrenadaGuamGuatemalaGuineaGuinea-BissauGuyanaHaitiHeavily indebted poor countries (HIPC)High incomeHondurasHong Kong SAR, ChinaHungaryIBRD onlyIcelandIDA & IBRD totalIDA blendIDA onlyIDA totalIndiaIndonesiaIran, Islamic Rep.IraqIrelandIsle of ManIsraelItalyJamaicaJapanJordanKazakhstanKenyaKiribatiKorea, Dem. People’s Rep.Korea, Rep.KosovoKuwaitKyrgyz RepublicLao PDRLate-demographic dividendLatin America & Caribbean Latin America & Caribbean (excluding high income)Latin America & the Caribbean (IDA & IBRD countries)LatviaLeast developed countries: UN classificationLebanonLesothoLiberiaLibyaLiechtensteinLithuaniaLow & middle incomeLow incomeLower middle incomeLuxembourgMacao SAR, ChinaMacedonia, FYRMadagascarMalawiMalaysiaMaldivesMaliMaltaMarshall IslandsMauritaniaMauritiusMexicoMicronesia, Fed. Sts.Middle East & North AfricaMiddle East & North Africa (excluding high income)Middle East & North Africa (IDA & IBRD countries)Middle incomeMoldovaMongoliaMontenegroMoroccoMozambiqueMyanmarNamibiaNepalNetherlandsNew CaledoniaNew ZealandNicaraguaNigerNigeriaNorth AmericaNorwayOECD membersOmanOther small statesPacific island small statesPakistanPalauPanamaPapua New GuineaParaguayPeruPhilippinesPolandPortugalPost-demographic dividendPre-demographic dividendPuerto RicoQatarRomaniaRussian FederationRwandaSamoaSan MarinoSao Tome and PrincipeSaudi ArabiaSenegalSerbiaSeychellesSierra LeoneSingaporeSint Maarten (Dutch part)Slovak RepublicSloveniaSmall statesSolomon IslandsSomaliaSouth AfricaSouth AsiaSouth Asia (IDA & IBRD)South SudanSpainSri LankaSt. Kitts and NevisSt. LuciaSt. Martin (French part)St. Vincent and the GrenadinesSub-Saharan Africa Sub-Saharan Africa (excluding high income)Sub-Saharan Africa (IDA & IBRD countries)SudanSurinameSwazilandSwedenSwitzerlandSyrian Arab RepublicTajikistanTanzaniaThailandTimor-LesteTogoTongaTrinidad and TobagoTunisiaTurkeyTurkmenistanUgandaUkraineUnited Arab EmiratesUnited KingdomUnited StatesUpper middle incomeUruguayUzbekistanVanuatuVenezuela, RBVietnamVirgin Islands (U.S.)West Bank and GazaWorldYemen, Rep.ZambiaZimbabwe Timeline:
This timeline shows a graph from 1961 to 2015 of Cameroon. No data until 1960. Number of actual observations by date: 55.
Source name:
World Development Indicators
Source organization:
(1) United Nations Population Division. World Population Prospects, (2) Census reports and other statistical publications from national statistical offices, (3) Eurostat: Demographic Statistics, (4) United Nations Statistical Division. Population and Vital Statistics Reprot (various years), (5) U.S. Census Bureau: International Database, and (6) Secretariat of the Pacific Community: Statistics and Demography Programme.
Categories, topics:
Health, Gender, Social Development
Last updated:
apr 23, 2017
Indicators value changes by year
Minimum:
40.234
jan 1, 1961
Maximum:
54.363
jan 1, 2015
At the date of observation
Value
Absolute change
Change from previous value
jan 1, 1961
40.234
+40.234
0.0%
jan 1, 1962
40.679
+0.445
1.11%
jan 1, 1963
41.124
+0.445
1.09%
jan 1, 1964
41.566
+0.442
1.07%
jan 1, 1965
42.005
+0.439
1.06%
jan 1, 1966
42.442
+0.437
1.04%
jan 1, 1967
42.879
+0.437
1.03%
jan 1, 1968
43.319
+0.44
1.03%
jan 1, 1969
43.767
+0.448
1.03%
jan 1, 1970
44.223
+0.456
1.04%
jan 1, 1971
44.692
+0.469
1.06%
jan 1, 1972
45.178
+0.486
1.09%
jan 1, 1973
45.68
+0.502
1.11%
jan 1, 1974
46.194
+0.514
1.13%
jan 1, 1975
46.716
+0.522
1.13%
jan 1, 1976
47.242
+0.526
1.13%
jan 1, 1977
47.767
+0.525
1.11%
jan 1, 1978
48.285
+0.518
1.08%
jan 1, 1979
48.786
+0.501
1.04%
jan 1, 1980
49.263
+0.477
0.98%
jan 1, 1981
49.708
+0.445
0.9%
jan 1, 1982
50.114
+0.406
0.82%
jan 1, 1983
50.481
+0.367
0.73%
jan 1, 1984
50.807
+0.326
0.65%
jan 1, 1985
51.091
+0.284
0.56%
jan 1, 1986
51.336
+0.245
0.48%
jan 1, 1987
51.546
+0.21
0.41%
jan 1, 1988
51.727
+0.181
0.35%
jan 1, 1989
51.881
+0.154
0.3%
jan 1, 1990
52.008
+0.127
0.24%
jan 1, 1991
52.102
+0.094
0.18%
jan 1, 1992
52.155
+0.053
0.1%
jan 1, 1993
52.16
+0.005
0.01%
jan 1, 1994
52.118
-0.042
-0.08%
jan 1, 1995
52.032
-0.086
-0.17%
jan 1, 1996
51.903
-0.129
-0.25%
jan 1, 1997
51.732
-0.171
-0.33%
jan 1, 1998
51.53
-0.202
-0.39%
jan 1, 1999
51.316
-0.214
-0.42%
jan 1, 2000
51.108
-0.208
-0.41%
jan 1, 2001
50.931
-0.177
-0.35%
jan 1, 2002
50.805
-0.126
-0.25%
jan 1, 2003
50.746
-0.059
-0.12%
jan 1, 2004
50.761
+0.015
0.03%
jan 1, 2005
50.856
+0.095
0.19%
jan 1, 2006
51.031
+0.175
0.34%
jan 1, 2007
51.28
+0.249
0.49%
jan 1, 2008
51.585
+0.305
0.59%
jan 1, 2009
51.929
+0.344
0.67%
jan 1, 2010
52.299
+0.37
0.71%
jan 1, 2011
52.688
+0.389
0.74%
jan 1, 2012
53.092
+0.404
0.77%
jan 1, 2013
53.508
+0.416
0.78%
jan 1, 2014
53.934
+0.426
0.8%
jan 1, 2015
54.363
+0.429
0.8%
Ranking of countries by current statistics by years


Comments: