29
/
en
AIzaSyAYiBZKx7MnpbEhh9jyipgxe19OcubqV5w
April 1, 2024
86165
Bhutan
BTN
true
2
1
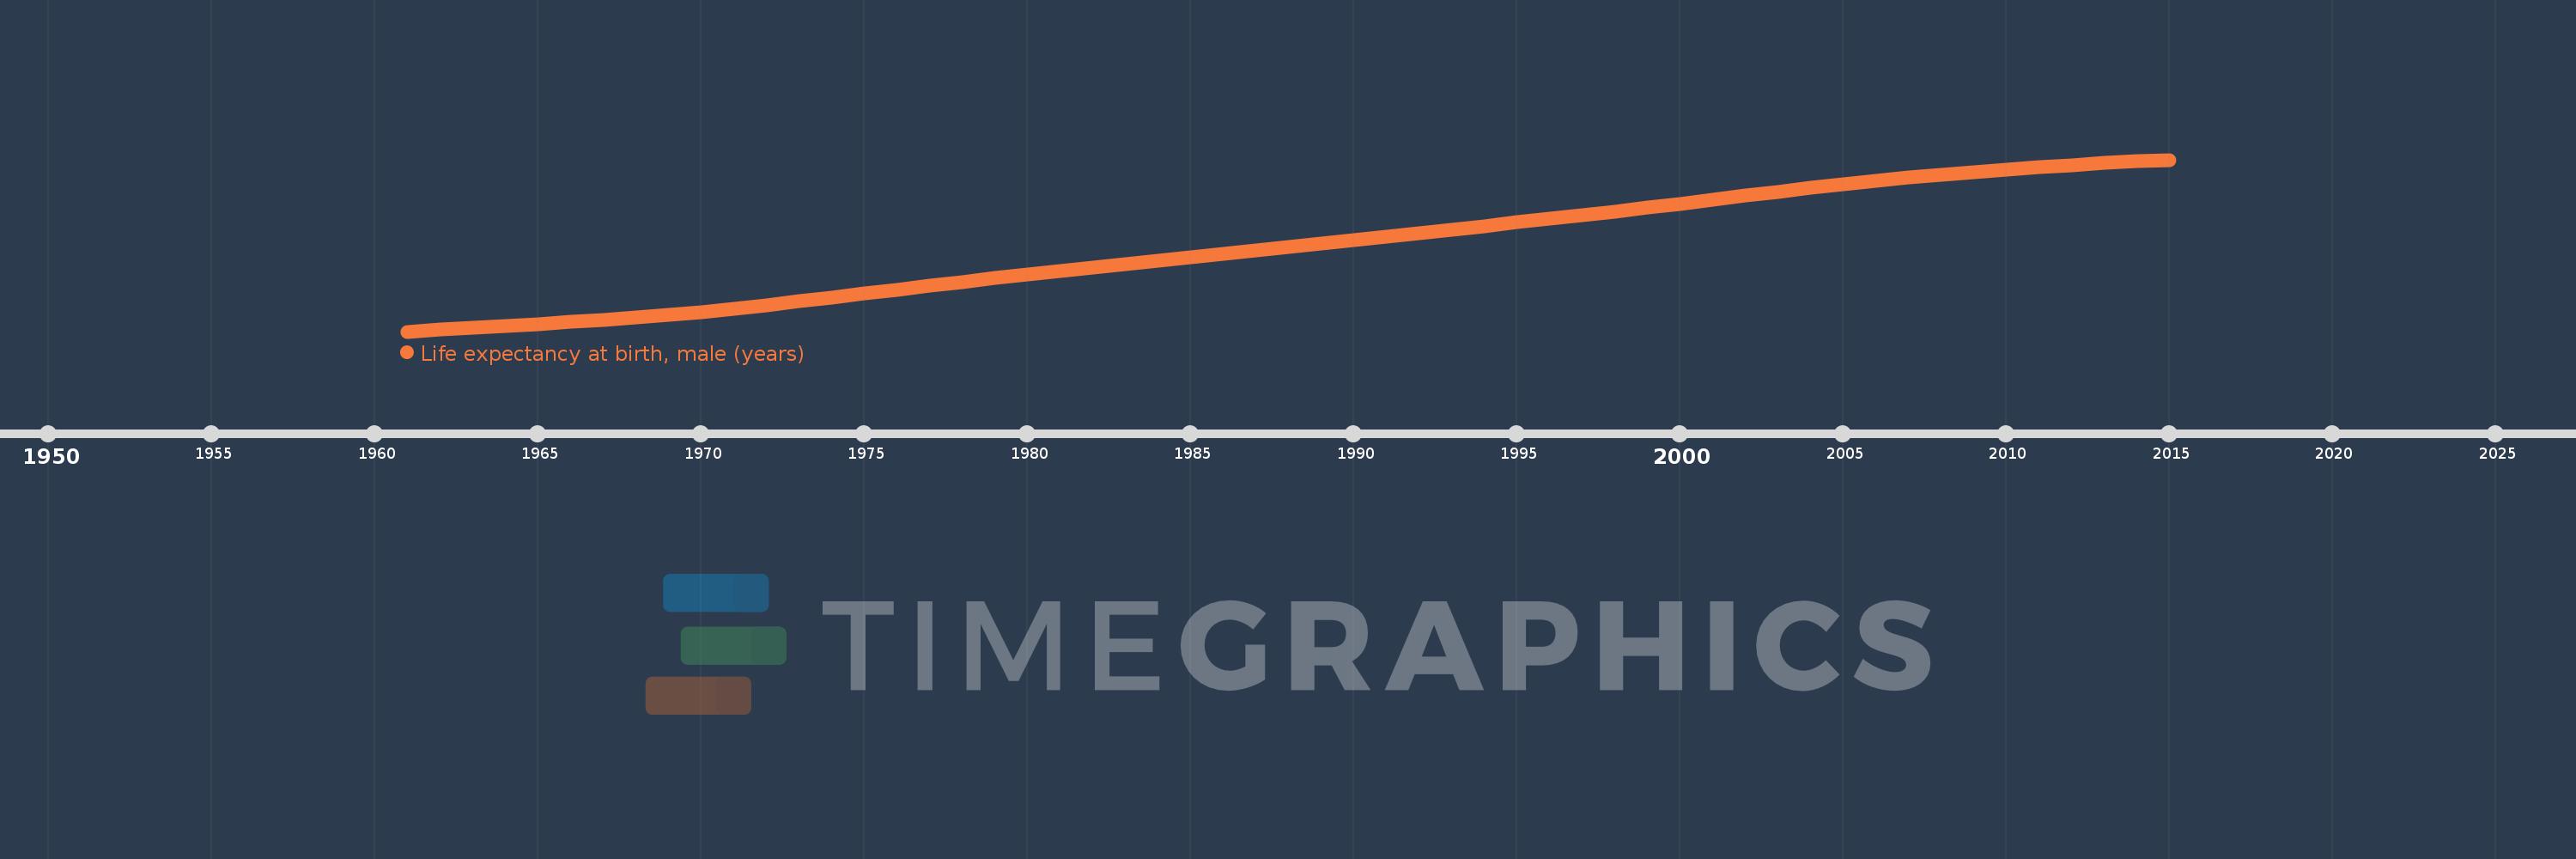
Life expectancy at birth, male (years)
2015,2014,2013,2012,2011,2010,2009,2008,2007,2006,2005,2004,2003,2002,2001,2000,1999,1998,1997,1996,1995,1994,1993,1992,1991,1990,1989,1988,1987,1986,1985,1984,1983,1982,1981,1980,1979,1978,1977,1976,1975,1974,1973,1972,1971,1970,1969,1968,1967,1966,1965,1964,1963,1962,1961
This statistics in other country:
AfghanistanAlbaniaAlgeriaAngolaAntigua and BarbudaArab WorldArgentinaArmeniaArubaAustraliaAustriaAzerbaijanBahamas, TheBahrainBangladeshBarbadosBelarusBelgiumBelizeBeninBermudaBhutanBoliviaBosnia and HerzegovinaBotswanaBrazilBrunei DarussalamBulgariaBurkina FasoBurundiCabo VerdeCambodiaCameroonCanadaCaribbean small statesCentral African RepublicCentral Europe and the BalticsChadChannel IslandsChileChinaColombiaComorosCongo, Dem. Rep.Congo, Rep.Costa RicaCote d'IvoireCroatiaCubaCuracaoCyprusCzech RepublicDenmarkDjiboutiDominicaDominican RepublicEarly-demographic dividendEast Asia & PacificEast Asia & Pacific (excluding high income)East Asia & Pacific (IDA & IBRD countries)EcuadorEgypt, Arab Rep.El SalvadorEquatorial GuineaEritreaEstoniaEthiopiaEuro areaEurope & Central AsiaEurope & Central Asia (excluding high income)Europe & Central Asia (IDA & IBRD countries)European UnionFaroe IslandsFijiFinlandFragile and conflict affected situationsFranceFrench PolynesiaGabonGambia, TheGeorgiaGermanyGhanaGreeceGreenlandGrenadaGuamGuatemalaGuineaGuinea-BissauGuyanaHaitiHeavily indebted poor countries (HIPC)High incomeHondurasHong Kong SAR, ChinaHungaryIBRD onlyIcelandIDA & IBRD totalIDA blendIDA onlyIDA totalIndiaIndonesiaIran, Islamic Rep.IraqIrelandIsle of ManIsraelItalyJamaicaJapanJordanKazakhstanKenyaKiribatiKorea, Dem. People’s Rep.Korea, Rep.KosovoKuwaitKyrgyz RepublicLao PDRLate-demographic dividendLatin America & Caribbean Latin America & Caribbean (excluding high income)Latin America & the Caribbean (IDA & IBRD countries)LatviaLeast developed countries: UN classificationLebanonLesothoLiberiaLibyaLiechtensteinLithuaniaLow & middle incomeLow incomeLower middle incomeLuxembourgMacao SAR, ChinaMacedonia, FYRMadagascarMalawiMalaysiaMaldivesMaliMaltaMarshall IslandsMauritaniaMauritiusMexicoMicronesia, Fed. Sts.Middle East & North AfricaMiddle East & North Africa (excluding high income)Middle East & North Africa (IDA & IBRD countries)Middle incomeMoldovaMongoliaMontenegroMoroccoMozambiqueMyanmarNamibiaNepalNetherlandsNew CaledoniaNew ZealandNicaraguaNigerNigeriaNorth AmericaNorwayOECD membersOmanOther small statesPacific island small statesPakistanPalauPanamaPapua New GuineaParaguayPeruPhilippinesPolandPortugalPost-demographic dividendPre-demographic dividendPuerto RicoQatarRomaniaRussian FederationRwandaSamoaSan MarinoSao Tome and PrincipeSaudi ArabiaSenegalSerbiaSeychellesSierra LeoneSingaporeSint Maarten (Dutch part)Slovak RepublicSloveniaSmall statesSolomon IslandsSomaliaSouth AfricaSouth AsiaSouth Asia (IDA & IBRD)South SudanSpainSri LankaSt. Kitts and NevisSt. LuciaSt. Martin (French part)St. Vincent and the GrenadinesSub-Saharan Africa Sub-Saharan Africa (excluding high income)Sub-Saharan Africa (IDA & IBRD countries)SudanSurinameSwazilandSwedenSwitzerlandSyrian Arab RepublicTajikistanTanzaniaThailandTimor-LesteTogoTongaTrinidad and TobagoTunisiaTurkeyTurkmenistanUgandaUkraineUnited Arab EmiratesUnited KingdomUnited StatesUpper middle incomeUruguayUzbekistanVanuatuVenezuela, RBVietnamVirgin Islands (U.S.)West Bank and GazaWorldYemen, Rep.ZambiaZimbabwe Timeline:
This timeline shows a graph from 1961 to 2015 of Bhutan. No data until 1960. Number of actual observations by date: 55.
Source name:
World Development Indicators
Source organization:
(1) United Nations Population Division. World Population Prospects, (2) Census reports and other statistical publications from national statistical offices, (3) Eurostat: Demographic Statistics, (4) United Nations Statistical Division. Population and Vital Statistics Reprot (various years), (5) U.S. Census Bureau: International Database, and (6) Secretariat of the Pacific Community: Statistics and Demography Programme.
Categories, topics:
Health, Gender, Social Development
Last updated:
apr 23, 2017
Indicators value changes by year
Minimum:
32.014
jan 1, 1961
Maximum:
69.221
jan 1, 2015
At the date of observation
Value
Absolute change
Change from previous value
jan 1, 1961
32.014
+32.014
0.0%
jan 1, 1962
32.432
+0.418
1.31%
jan 1, 1963
32.84
+0.408
1.26%
jan 1, 1964
33.241
+0.401
1.22%
jan 1, 1965
33.646
+0.405
1.22%
jan 1, 1966
34.07
+0.424
1.26%
jan 1, 1967
34.533
+0.463
1.36%
jan 1, 1968
35.048
+0.515
1.49%
jan 1, 1969
35.625
+0.577
1.65%
jan 1, 1970
36.267
+0.642
1.8%
jan 1, 1971
36.974
+0.707
1.95%
jan 1, 1972
37.741
+0.767
2.07%
jan 1, 1973
38.551
+0.81
2.15%
jan 1, 1974
39.387
+0.836
2.17%
jan 1, 1975
40.236
+0.849
2.16%
jan 1, 1976
41.086
+0.85
2.11%
jan 1, 1977
41.926
+0.84
2.04%
jan 1, 1978
42.754
+0.828
1.97%
jan 1, 1979
43.566
+0.812
1.9%
jan 1, 1980
44.359
+0.793
1.82%
jan 1, 1981
45.13
+0.771
1.74%
jan 1, 1982
45.88
+0.75
1.66%
jan 1, 1983
46.617
+0.737
1.61%
jan 1, 1984
47.346
+0.729
1.56%
jan 1, 1985
48.073
+0.727
1.54%
jan 1, 1986
48.802
+0.729
1.52%
jan 1, 1987
49.539
+0.737
1.51%
jan 1, 1988
50.284
+0.745
1.5%
jan 1, 1989
51.038
+0.754
1.5%
jan 1, 1990
51.803
+0.765
1.5%
jan 1, 1991
52.575
+0.772
1.49%
jan 1, 1992
53.349
+0.774
1.47%
jan 1, 1993
54.121
+0.772
1.45%
jan 1, 1994
54.89
+0.769
1.42%
jan 1, 1995
55.656
+0.766
1.4%
jan 1, 1996
56.429
+0.773
1.39%
jan 1, 1997
57.216
+0.787
1.39%
jan 1, 1998
58.025
+0.809
1.41%
jan 1, 1999
58.856
+0.831
1.43%
jan 1, 2000
59.705
+0.849
1.44%
jan 1, 2001
60.566
+0.861
1.44%
jan 1, 2002
61.432
+0.866
1.43%
jan 1, 2003
62.289
+0.857
1.4%
jan 1, 2004
63.123
+0.834
1.34%
jan 1, 2005
63.923
+0.8
1.27%
jan 1, 2006
64.676
+0.753
1.18%
jan 1, 2007
65.374
+0.698
1.08%
jan 1, 2008
66.017
+0.643
0.98%
jan 1, 2009
66.606
+0.589
0.89%
jan 1, 2010
67.143
+0.537
0.81%
jan 1, 2011
67.629
+0.486
0.72%
jan 1, 2012
68.071
+0.442
0.65%
jan 1, 2013
68.479
+0.408
0.6%
jan 1, 2014
68.86
+0.381
0.56%
jan 1, 2015
69.221
+0.361
0.52%
Ranking of countries by current statistics by years


Comments: