29
/
en
AIzaSyAYiBZKx7MnpbEhh9jyipgxe19OcubqV5w
April 1, 2024
215478
Oman
OMN
true
2
1
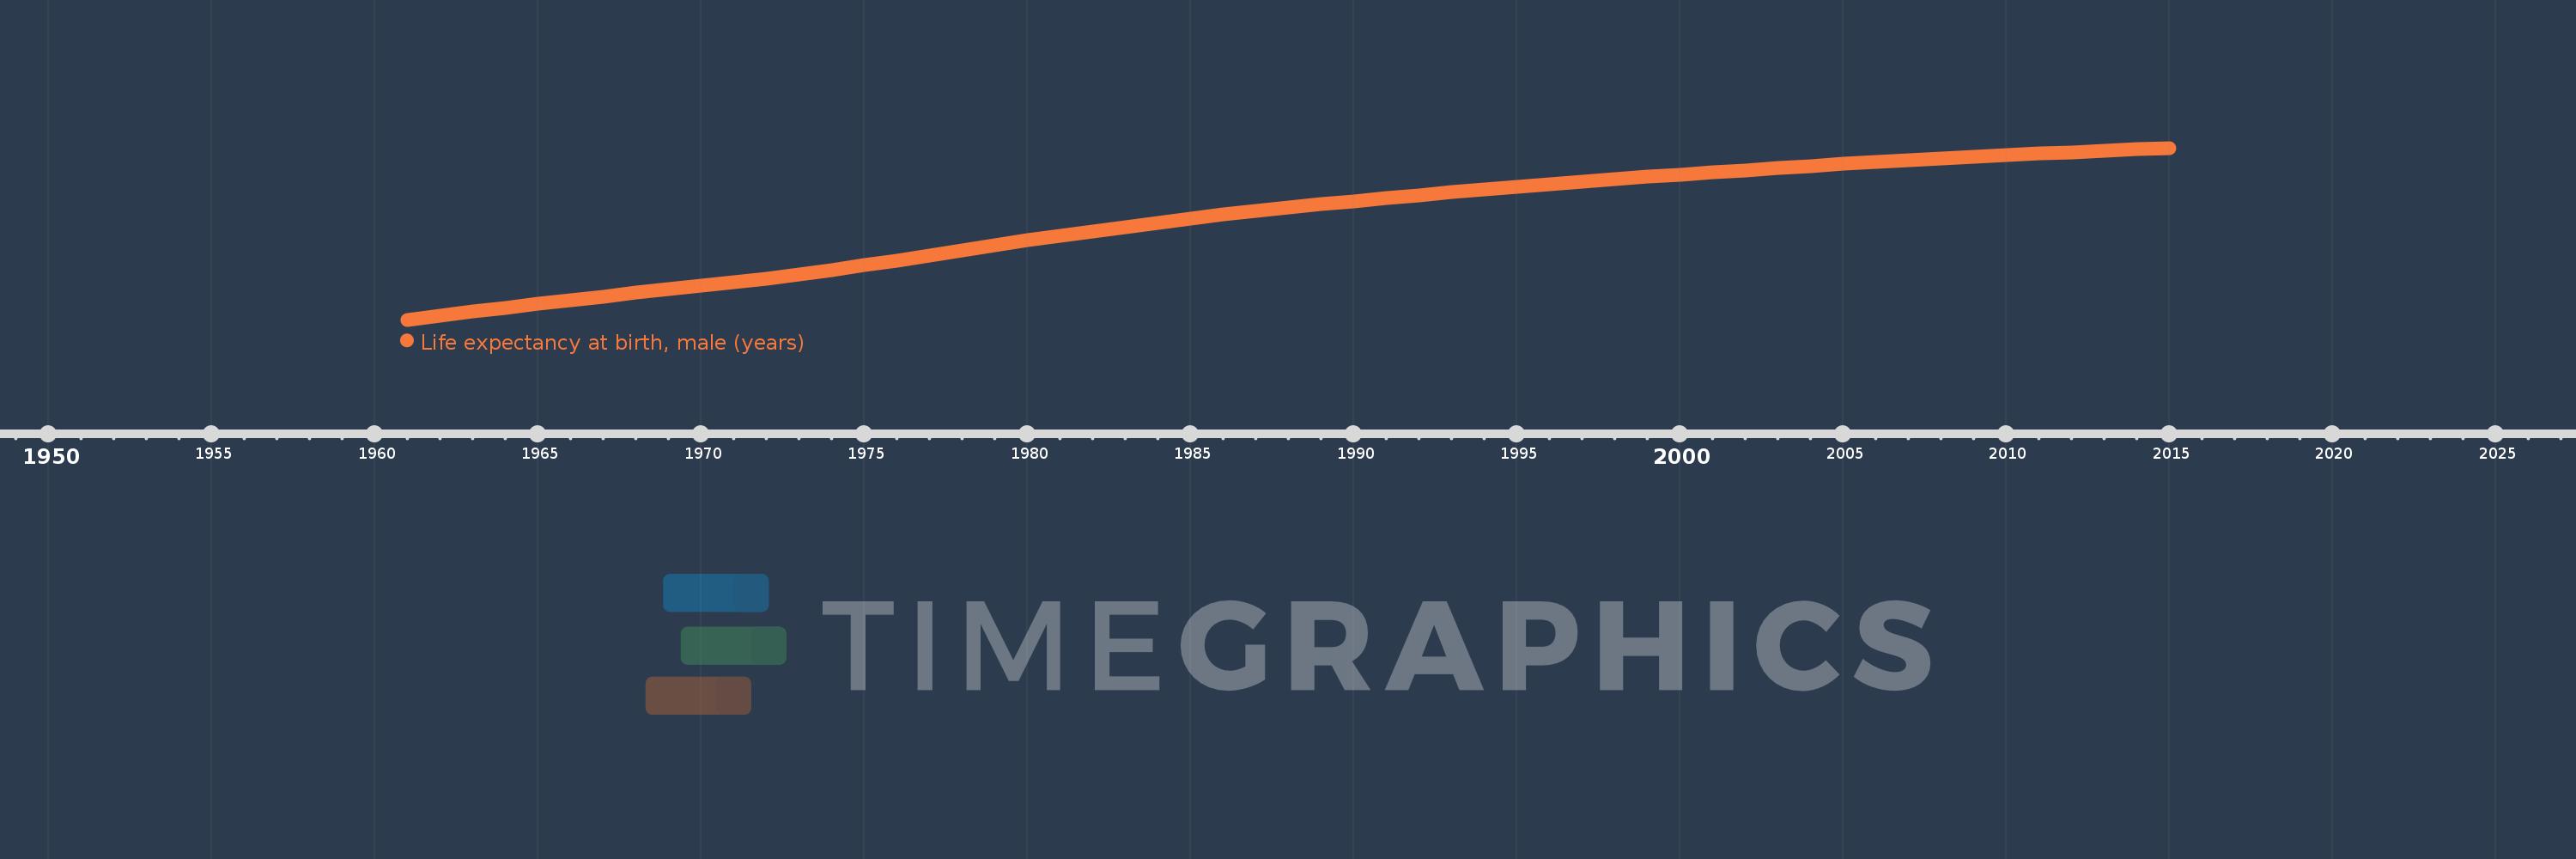
Life expectancy at birth, male (years)
2015,2014,2013,2012,2011,2010,2009,2008,2007,2006,2005,2004,2003,2002,2001,2000,1999,1998,1997,1996,1995,1994,1993,1992,1991,1990,1989,1988,1987,1986,1985,1984,1983,1982,1981,1980,1979,1978,1977,1976,1975,1974,1973,1972,1971,1970,1969,1968,1967,1966,1965,1964,1963,1962,1961
This statistics in other country:
AfghanistanAlbaniaAlgeriaAngolaAntigua and BarbudaArab WorldArgentinaArmeniaArubaAustraliaAustriaAzerbaijanBahamas, TheBahrainBangladeshBarbadosBelarusBelgiumBelizeBeninBermudaBhutanBoliviaBosnia and HerzegovinaBotswanaBrazilBrunei DarussalamBulgariaBurkina FasoBurundiCabo VerdeCambodiaCameroonCanadaCaribbean small statesCentral African RepublicCentral Europe and the BalticsChadChannel IslandsChileChinaColombiaComorosCongo, Dem. Rep.Congo, Rep.Costa RicaCote d'IvoireCroatiaCubaCuracaoCyprusCzech RepublicDenmarkDjiboutiDominicaDominican RepublicEarly-demographic dividendEast Asia & PacificEast Asia & Pacific (excluding high income)East Asia & Pacific (IDA & IBRD countries)EcuadorEgypt, Arab Rep.El SalvadorEquatorial GuineaEritreaEstoniaEthiopiaEuro areaEurope & Central AsiaEurope & Central Asia (excluding high income)Europe & Central Asia (IDA & IBRD countries)European UnionFaroe IslandsFijiFinlandFragile and conflict affected situationsFranceFrench PolynesiaGabonGambia, TheGeorgiaGermanyGhanaGreeceGreenlandGrenadaGuamGuatemalaGuineaGuinea-BissauGuyanaHaitiHeavily indebted poor countries (HIPC)High incomeHondurasHong Kong SAR, ChinaHungaryIBRD onlyIcelandIDA & IBRD totalIDA blendIDA onlyIDA totalIndiaIndonesiaIran, Islamic Rep.IraqIrelandIsle of ManIsraelItalyJamaicaJapanJordanKazakhstanKenyaKiribatiKorea, Dem. People’s Rep.Korea, Rep.KosovoKuwaitKyrgyz RepublicLao PDRLate-demographic dividendLatin America & Caribbean Latin America & Caribbean (excluding high income)Latin America & the Caribbean (IDA & IBRD countries)LatviaLeast developed countries: UN classificationLebanonLesothoLiberiaLibyaLiechtensteinLithuaniaLow & middle incomeLow incomeLower middle incomeLuxembourgMacao SAR, ChinaMacedonia, FYRMadagascarMalawiMalaysiaMaldivesMaliMaltaMarshall IslandsMauritaniaMauritiusMexicoMicronesia, Fed. Sts.Middle East & North AfricaMiddle East & North Africa (excluding high income)Middle East & North Africa (IDA & IBRD countries)Middle incomeMoldovaMongoliaMontenegroMoroccoMozambiqueMyanmarNamibiaNepalNetherlandsNew CaledoniaNew ZealandNicaraguaNigerNigeriaNorth AmericaNorwayOECD membersOmanOther small statesPacific island small statesPakistanPalauPanamaPapua New GuineaParaguayPeruPhilippinesPolandPortugalPost-demographic dividendPre-demographic dividendPuerto RicoQatarRomaniaRussian FederationRwandaSamoaSan MarinoSao Tome and PrincipeSaudi ArabiaSenegalSerbiaSeychellesSierra LeoneSingaporeSint Maarten (Dutch part)Slovak RepublicSloveniaSmall statesSolomon IslandsSomaliaSouth AfricaSouth AsiaSouth Asia (IDA & IBRD)South SudanSpainSri LankaSt. Kitts and NevisSt. LuciaSt. Martin (French part)St. Vincent and the GrenadinesSub-Saharan Africa Sub-Saharan Africa (excluding high income)Sub-Saharan Africa (IDA & IBRD countries)SudanSurinameSwazilandSwedenSwitzerlandSyrian Arab RepublicTajikistanTanzaniaThailandTimor-LesteTogoTongaTrinidad and TobagoTunisiaTurkeyTurkmenistanUgandaUkraineUnited Arab EmiratesUnited KingdomUnited StatesUpper middle incomeUruguayUzbekistanVanuatuVenezuela, RBVietnamVirgin Islands (U.S.)West Bank and GazaWorldYemen, Rep.ZambiaZimbabwe Timeline:
This timeline shows a graph from 1961 to 2015 of Oman. No data until 1960. Number of actual observations by date: 55.
Source name:
World Development Indicators
Source organization:
(1) United Nations Population Division. World Population Prospects, (2) Census reports and other statistical publications from national statistical offices, (3) Eurostat: Demographic Statistics, (4) United Nations Statistical Division. Population and Vital Statistics Reprot (various years), (5) U.S. Census Bureau: International Database, and (6) Secretariat of the Pacific Community: Statistics and Demography Programme.
Categories, topics:
Health, Gender, Social Development
Last updated:
apr 23, 2017
Indicators value changes by year
Maximum:
75.069
jan 1, 2015
At the date of observation
Value
Absolute change
Change from previous value
jan 1, 1961
41.87
+41.87
0.0%
jan 1, 1962
42.652
+0.782
1.87%
jan 1, 1963
43.421
+0.769
1.8%
jan 1, 1964
44.177
+0.756
1.74%
jan 1, 1965
44.92
+0.743
1.68%
jan 1, 1966
45.649
+0.729
1.62%
jan 1, 1967
46.358
+0.709
1.55%
jan 1, 1968
47.05
+0.692
1.49%
jan 1, 1969
47.732
+0.682
1.45%
jan 1, 1970
48.414
+0.682
1.43%
jan 1, 1971
49.115
+0.701
1.45%
jan 1, 1972
49.854
+0.739
1.5%
jan 1, 1973
50.645
+0.791
1.59%
jan 1, 1974
51.49
+0.845
1.67%
jan 1, 1975
52.388
+0.898
1.74%
jan 1, 1976
53.331
+0.943
1.8%
jan 1, 1977
54.304
+0.973
1.82%
jan 1, 1978
55.286
+0.982
1.81%
jan 1, 1979
56.255
+0.969
1.75%
jan 1, 1980
57.2
+0.945
1.68%
jan 1, 1981
58.11
+0.91
1.59%
jan 1, 1982
58.984
+0.874
1.5%
jan 1, 1983
59.825
+0.841
1.43%
jan 1, 1984
60.637
+0.812
1.36%
jan 1, 1985
61.418
+0.781
1.29%
jan 1, 1986
62.165
+0.747
1.22%
jan 1, 1987
62.876
+0.711
1.14%
jan 1, 1988
63.553
+0.677
1.08%
jan 1, 1989
64.197
+0.644
1.01%
jan 1, 1990
64.81
+0.613
0.95%
jan 1, 1991
65.397
+0.587
0.91%
jan 1, 1992
65.96
+0.563
0.86%
jan 1, 1993
66.505
+0.545
0.83%
jan 1, 1994
67.033
+0.528
0.79%
jan 1, 1995
67.548
+0.515
0.77%
jan 1, 1996
68.05
+0.502
0.74%
jan 1, 1997
68.541
+0.491
0.72%
jan 1, 1998
69.018
+0.477
0.7%
jan 1, 1999
69.479
+0.461
0.67%
jan 1, 2000
69.926
+0.447
0.64%
jan 1, 2001
70.36
+0.434
0.62%
jan 1, 2002
70.779
+0.419
0.6%
jan 1, 2003
71.186
+0.407
0.58%
jan 1, 2004
71.581
+0.395
0.55%
jan 1, 2005
71.963
+0.382
0.53%
jan 1, 2006
72.332
+0.369
0.51%
jan 1, 2007
72.687
+0.355
0.49%
jan 1, 2008
73.028
+0.341
0.47%
jan 1, 2009
73.354
+0.326
0.45%
jan 1, 2010
73.666
+0.312
0.43%
jan 1, 2011
73.965
+0.299
0.41%
jan 1, 2012
74.253
+0.288
0.39%
jan 1, 2013
74.532
+0.279
0.38%
jan 1, 2014
74.803
+0.271
0.36%
jan 1, 2015
75.069
+0.266
0.36%
Ranking of countries by current statistics by years


Comments: