29
/
en
AIzaSyAYiBZKx7MnpbEhh9jyipgxe19OcubqV5w
April 1, 2024
39152
IDA only
IDX
false
2
1
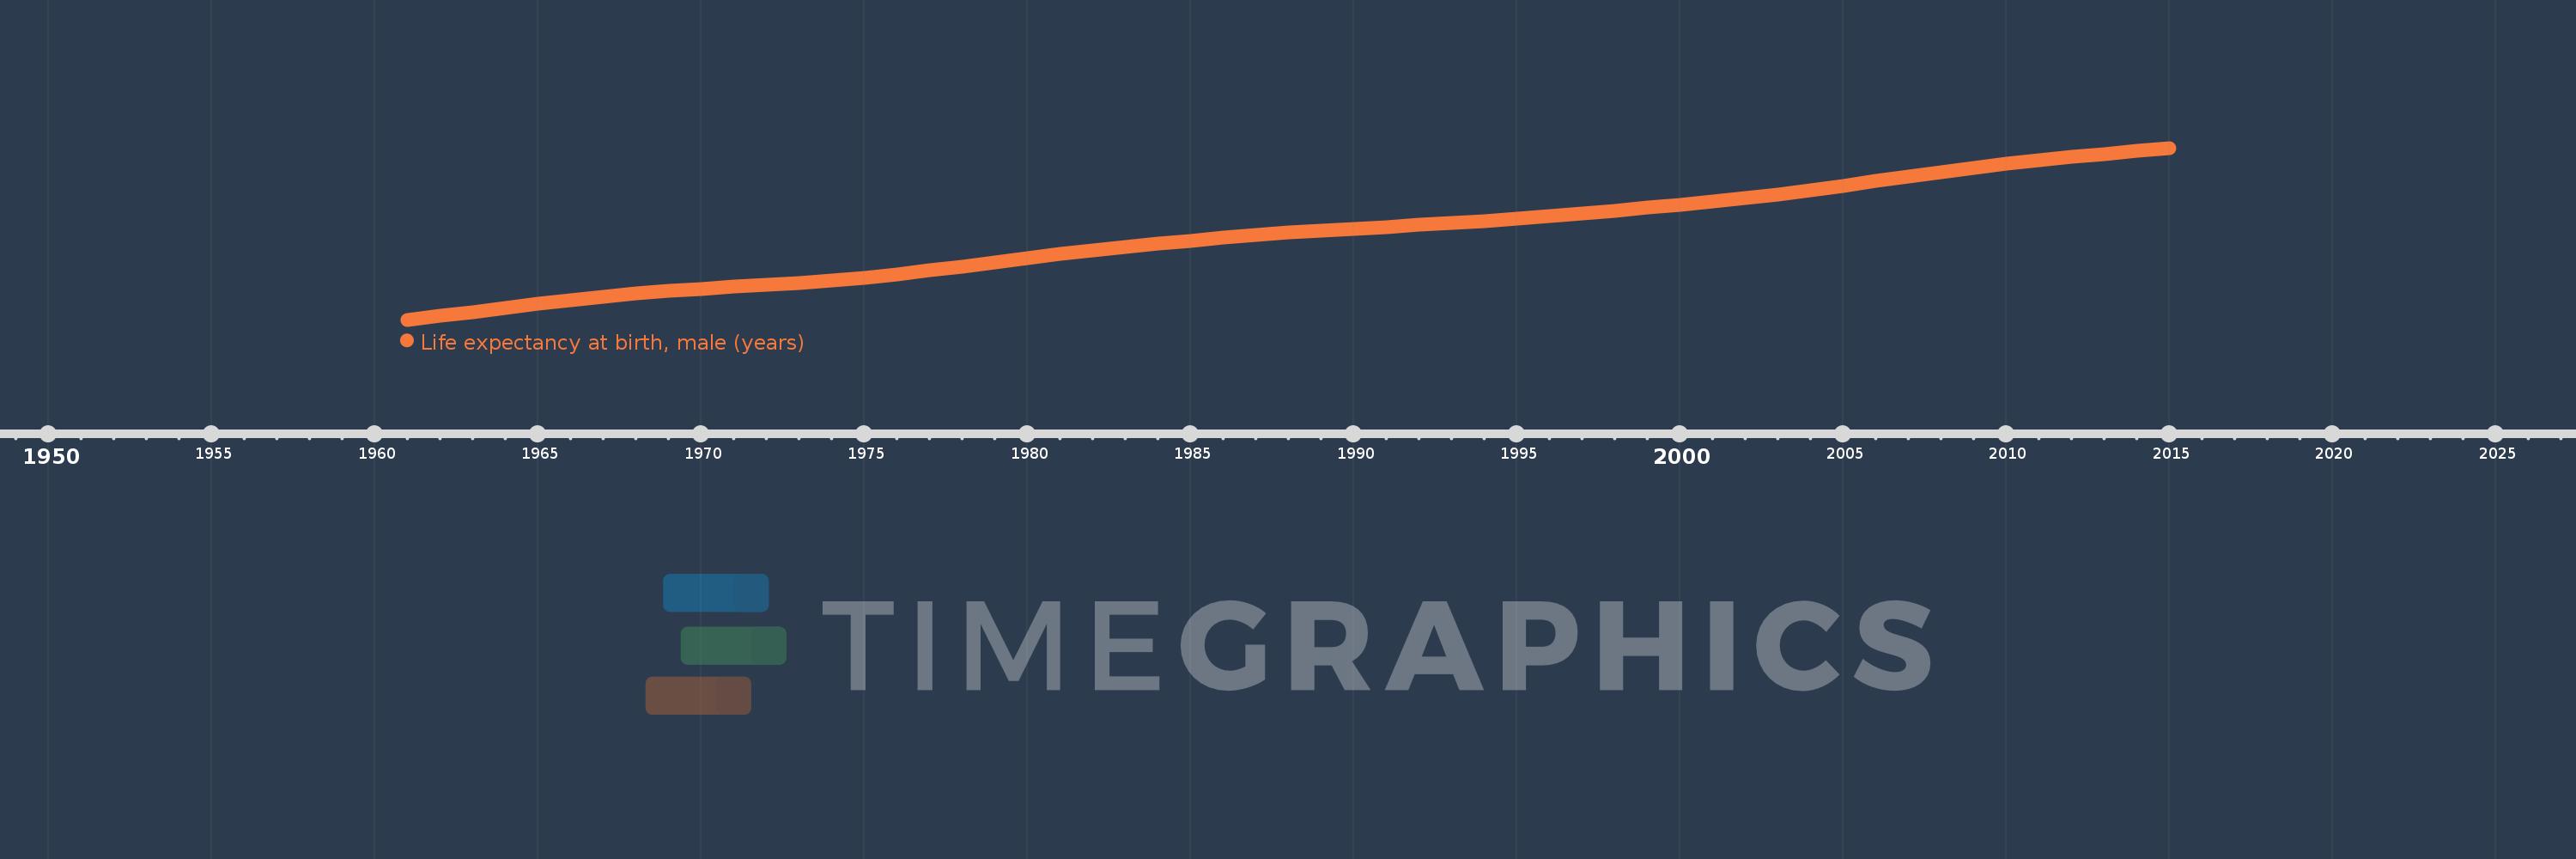
Life expectancy at birth, male (years)
2015,2014,2013,2012,2011,2010,2009,2008,2007,2006,2005,2004,2003,2002,2001,2000,1999,1998,1997,1996,1995,1994,1993,1992,1991,1990,1989,1988,1987,1986,1985,1984,1983,1982,1981,1980,1979,1978,1977,1976,1975,1974,1973,1972,1971,1970,1969,1968,1967,1966,1965,1964,1963,1962,1961
This statistics in other country:
AfghanistanAlbaniaAlgeriaAngolaAntigua and BarbudaArab WorldArgentinaArmeniaArubaAustraliaAustriaAzerbaijanBahamas, TheBahrainBangladeshBarbadosBelarusBelgiumBelizeBeninBermudaBhutanBoliviaBosnia and HerzegovinaBotswanaBrazilBrunei DarussalamBulgariaBurkina FasoBurundiCabo VerdeCambodiaCameroonCanadaCaribbean small statesCentral African RepublicCentral Europe and the BalticsChadChannel IslandsChileChinaColombiaComorosCongo, Dem. Rep.Congo, Rep.Costa RicaCote d'IvoireCroatiaCubaCuracaoCyprusCzech RepublicDenmarkDjiboutiDominicaDominican RepublicEarly-demographic dividendEast Asia & PacificEast Asia & Pacific (excluding high income)East Asia & Pacific (IDA & IBRD countries)EcuadorEgypt, Arab Rep.El SalvadorEquatorial GuineaEritreaEstoniaEthiopiaEuro areaEurope & Central AsiaEurope & Central Asia (excluding high income)Europe & Central Asia (IDA & IBRD countries)European UnionFaroe IslandsFijiFinlandFragile and conflict affected situationsFranceFrench PolynesiaGabonGambia, TheGeorgiaGermanyGhanaGreeceGreenlandGrenadaGuamGuatemalaGuineaGuinea-BissauGuyanaHaitiHeavily indebted poor countries (HIPC)High incomeHondurasHong Kong SAR, ChinaHungaryIBRD onlyIcelandIDA & IBRD totalIDA blendIDA onlyIDA totalIndiaIndonesiaIran, Islamic Rep.IraqIrelandIsle of ManIsraelItalyJamaicaJapanJordanKazakhstanKenyaKiribatiKorea, Dem. People’s Rep.Korea, Rep.KosovoKuwaitKyrgyz RepublicLao PDRLate-demographic dividendLatin America & Caribbean Latin America & Caribbean (excluding high income)Latin America & the Caribbean (IDA & IBRD countries)LatviaLeast developed countries: UN classificationLebanonLesothoLiberiaLibyaLiechtensteinLithuaniaLow & middle incomeLow incomeLower middle incomeLuxembourgMacao SAR, ChinaMacedonia, FYRMadagascarMalawiMalaysiaMaldivesMaliMaltaMarshall IslandsMauritaniaMauritiusMexicoMicronesia, Fed. Sts.Middle East & North AfricaMiddle East & North Africa (excluding high income)Middle East & North Africa (IDA & IBRD countries)Middle incomeMoldovaMongoliaMontenegroMoroccoMozambiqueMyanmarNamibiaNepalNetherlandsNew CaledoniaNew ZealandNicaraguaNigerNigeriaNorth AmericaNorwayOECD membersOmanOther small statesPacific island small statesPakistanPalauPanamaPapua New GuineaParaguayPeruPhilippinesPolandPortugalPost-demographic dividendPre-demographic dividendPuerto RicoQatarRomaniaRussian FederationRwandaSamoaSan MarinoSao Tome and PrincipeSaudi ArabiaSenegalSerbiaSeychellesSierra LeoneSingaporeSint Maarten (Dutch part)Slovak RepublicSloveniaSmall statesSolomon IslandsSomaliaSouth AfricaSouth AsiaSouth Asia (IDA & IBRD)South SudanSpainSri LankaSt. Kitts and NevisSt. LuciaSt. Martin (French part)St. Vincent and the GrenadinesSub-Saharan Africa Sub-Saharan Africa (excluding high income)Sub-Saharan Africa (IDA & IBRD countries)SudanSurinameSwazilandSwedenSwitzerlandSyrian Arab RepublicTajikistanTanzaniaThailandTimor-LesteTogoTongaTrinidad and TobagoTunisiaTurkeyTurkmenistanUgandaUkraineUnited Arab EmiratesUnited KingdomUnited StatesUpper middle incomeUruguayUzbekistanVanuatuVenezuela, RBVietnamVirgin Islands (U.S.)West Bank and GazaWorldYemen, Rep.ZambiaZimbabwe Timeline:
This timeline shows a graph from 1961 to 2015 of IDA only. No data until 1960. Number of actual observations by date: 55.
Source name:
World Development Indicators
Source organization:
(1) United Nations Population Division. World Population Prospects, (2) Census reports and other statistical publications from national statistical offices, (3) Eurostat: Demographic Statistics, (4) United Nations Statistical Division. Population and Vital Statistics Reprot (various years), (5) U.S. Census Bureau: International Database, and (6) Secretariat of the Pacific Community: Statistics and Demography Programme.
Categories, topics:
Health, Gender, Social Development
Last updated:
apr 23, 2017
Indicators value changes by year
Maximum:
61.893
jan 1, 2015
At the date of observation
Value
Absolute change
Change from previous value
jan 1, 1961
40.13
+40.13
0.0%
jan 1, 1962
40.619
+0.49
1.22%
jan 1, 1963
41.116
+0.497
1.22%
jan 1, 1964
41.62
+0.504
1.23%
jan 1, 1965
42.124
+0.504
1.21%
jan 1, 1966
42.61
+0.486
1.15%
jan 1, 1967
43.056
+0.446
1.05%
jan 1, 1968
43.448
+0.392
0.91%
jan 1, 1969
43.781
+0.333
0.77%
jan 1, 1970
44.06
+0.279
0.64%
jan 1, 1971
44.304
+0.244
0.55%
jan 1, 1972
44.542
+0.237
0.54%
jan 1, 1973
44.801
+0.259
0.58%
jan 1, 1974
45.105
+0.303
0.68%
jan 1, 1975
45.464
+0.359
0.8%
jan 1, 1976
45.886
+0.422
0.93%
jan 1, 1977
46.369
+0.483
1.05%
jan 1, 1978
46.891
+0.522
1.13%
jan 1, 1979
47.423
+0.532
1.13%
jan 1, 1980
47.941
+0.518
1.09%
jan 1, 1981
48.43
+0.49
1.02%
jan 1, 1982
48.89
+0.459
0.95%
jan 1, 1983
49.328
+0.438
0.9%
jan 1, 1984
49.75
+0.422
0.86%
jan 1, 1985
50.154
+0.404
0.81%
jan 1, 1986
50.531
+0.377
0.75%
jan 1, 1987
50.87
+0.339
0.67%
jan 1, 1988
51.167
+0.297
0.58%
jan 1, 1989
51.426
+0.259
0.51%
jan 1, 1990
51.672
+0.246
0.48%
jan 1, 1991
51.892
+0.22
0.43%
jan 1, 1992
52.127
+0.235
0.45%
jan 1, 1993
52.38
+0.253
0.49%
jan 1, 1994
52.652
+0.273
0.52%
jan 1, 1995
52.946
+0.293
0.56%
jan 1, 1996
53.262
+0.316
0.6%
jan 1, 1997
53.598
+0.336
0.63%
jan 1, 1998
53.943
+0.345
0.64%
jan 1, 1999
54.303
+0.361
0.67%
jan 1, 2000
54.691
+0.388
0.71%
jan 1, 2001
55.095
+0.404
0.74%
jan 1, 2002
55.538
+0.443
0.8%
jan 1, 2003
56.019
+0.482
0.87%
jan 1, 2004
56.547
+0.527
0.94%
jan 1, 2005
57.105
+0.558
0.99%
jan 1, 2006
57.683
+0.578
1.01%
jan 1, 2007
58.261
+0.578
1.0%
jan 1, 2008
58.829
+0.568
0.98%
jan 1, 2009
59.371
+0.542
0.92%
jan 1, 2010
59.874
+0.502
0.85%
jan 1, 2011
60.345
+0.472
0.79%
jan 1, 2012
60.752
+0.407
0.67%
jan 1, 2013
61.148
+0.396
0.65%
jan 1, 2014
61.528
+0.38
0.62%
jan 1, 2015
61.893
+0.365
0.59%
Ranking of countries by current statistics by years


Comments: