29
/
en
AIzaSyAYiBZKx7MnpbEhh9jyipgxe19OcubqV5w
April 1, 2024
91387
Brazil
BRA
true
2
1
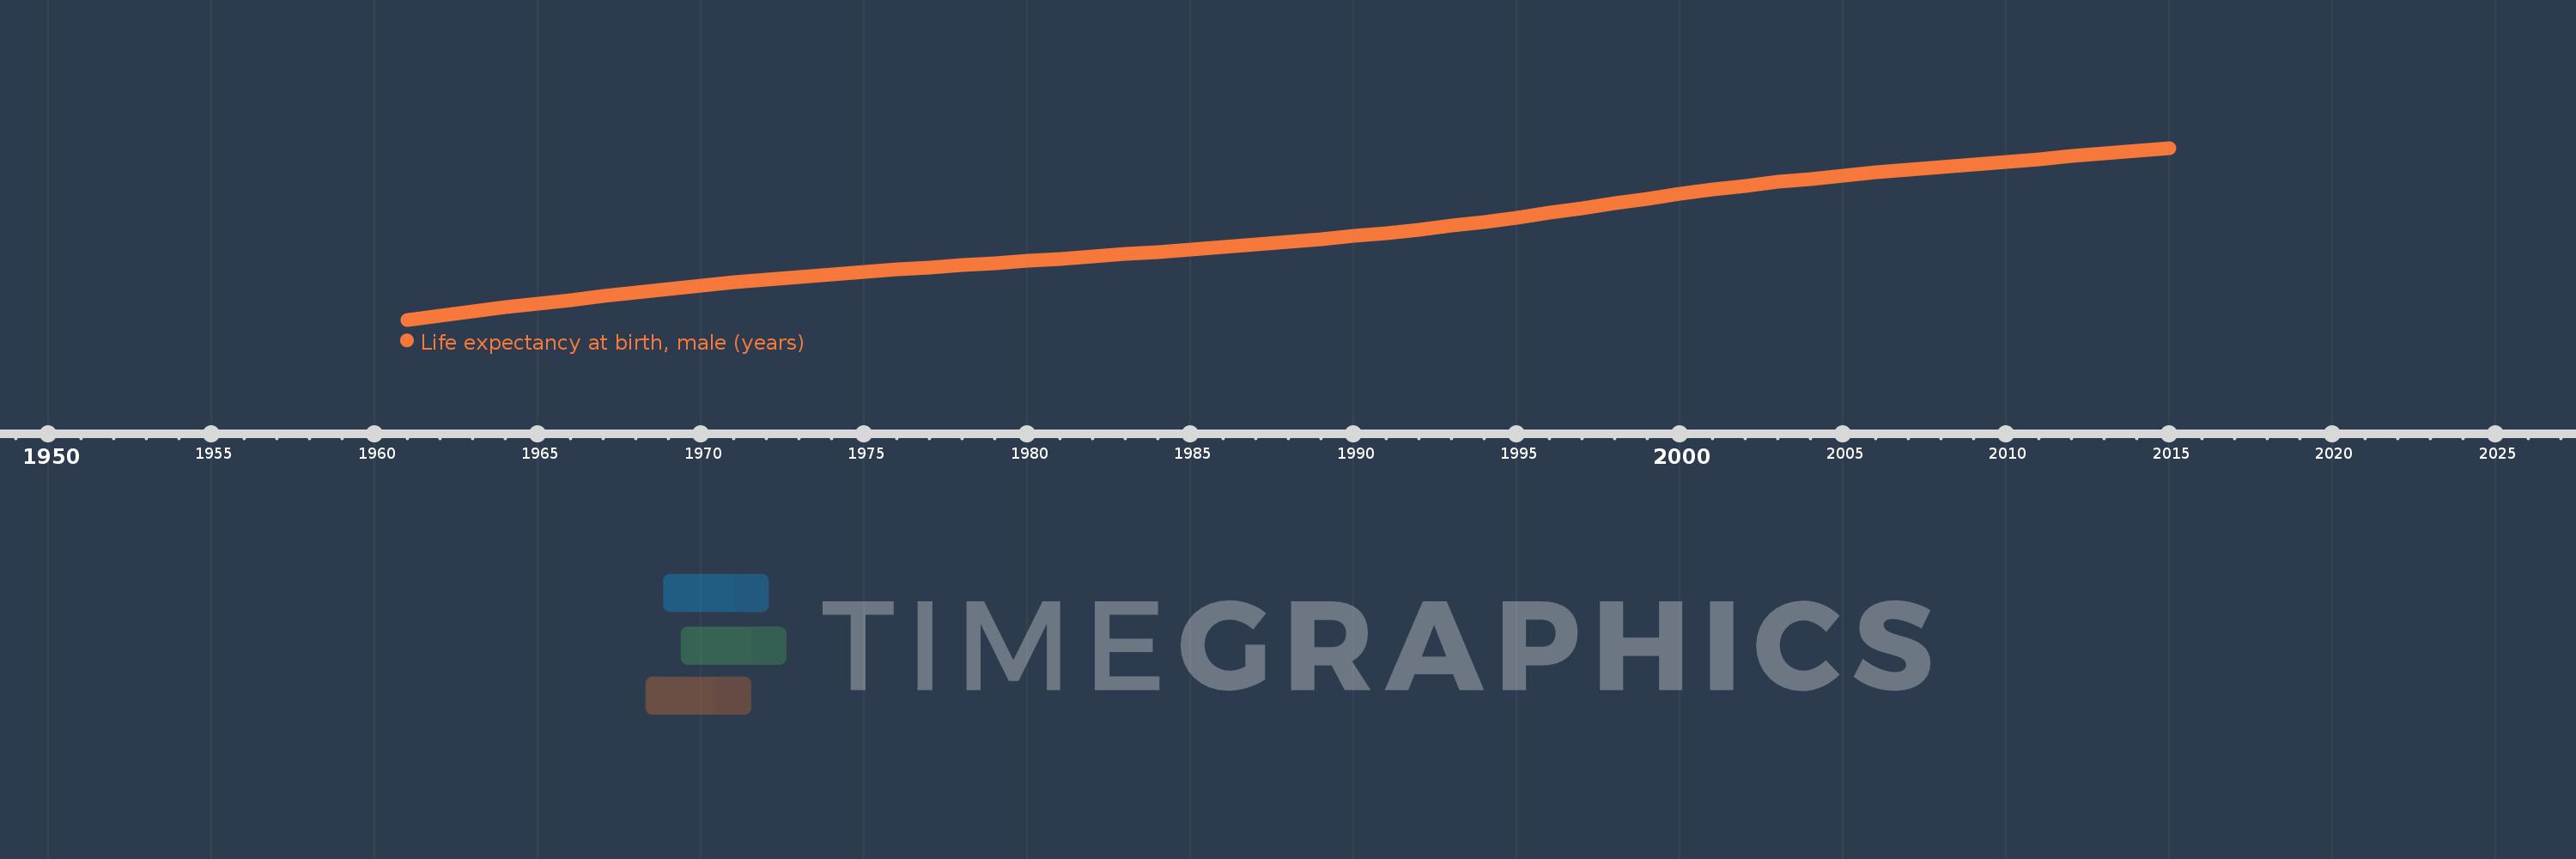
Life expectancy at birth, male (years)
2015,2014,2013,2012,2011,2010,2009,2008,2007,2006,2005,2004,2003,2002,2001,2000,1999,1998,1997,1996,1995,1994,1993,1992,1991,1990,1989,1988,1987,1986,1985,1984,1983,1982,1981,1980,1979,1978,1977,1976,1975,1974,1973,1972,1971,1970,1969,1968,1967,1966,1965,1964,1963,1962,1961
This statistics in other country:
AfghanistanAlbaniaAlgeriaAngolaAntigua and BarbudaArab WorldArgentinaArmeniaArubaAustraliaAustriaAzerbaijanBahamas, TheBahrainBangladeshBarbadosBelarusBelgiumBelizeBeninBermudaBhutanBoliviaBosnia and HerzegovinaBotswanaBrazilBrunei DarussalamBulgariaBurkina FasoBurundiCabo VerdeCambodiaCameroonCanadaCaribbean small statesCentral African RepublicCentral Europe and the BalticsChadChannel IslandsChileChinaColombiaComorosCongo, Dem. Rep.Congo, Rep.Costa RicaCote d'IvoireCroatiaCubaCuracaoCyprusCzech RepublicDenmarkDjiboutiDominicaDominican RepublicEarly-demographic dividendEast Asia & PacificEast Asia & Pacific (excluding high income)East Asia & Pacific (IDA & IBRD countries)EcuadorEgypt, Arab Rep.El SalvadorEquatorial GuineaEritreaEstoniaEthiopiaEuro areaEurope & Central AsiaEurope & Central Asia (excluding high income)Europe & Central Asia (IDA & IBRD countries)European UnionFaroe IslandsFijiFinlandFragile and conflict affected situationsFranceFrench PolynesiaGabonGambia, TheGeorgiaGermanyGhanaGreeceGreenlandGrenadaGuamGuatemalaGuineaGuinea-BissauGuyanaHaitiHeavily indebted poor countries (HIPC)High incomeHondurasHong Kong SAR, ChinaHungaryIBRD onlyIcelandIDA & IBRD totalIDA blendIDA onlyIDA totalIndiaIndonesiaIran, Islamic Rep.IraqIrelandIsle of ManIsraelItalyJamaicaJapanJordanKazakhstanKenyaKiribatiKorea, Dem. People’s Rep.Korea, Rep.KosovoKuwaitKyrgyz RepublicLao PDRLate-demographic dividendLatin America & Caribbean Latin America & Caribbean (excluding high income)Latin America & the Caribbean (IDA & IBRD countries)LatviaLeast developed countries: UN classificationLebanonLesothoLiberiaLibyaLiechtensteinLithuaniaLow & middle incomeLow incomeLower middle incomeLuxembourgMacao SAR, ChinaMacedonia, FYRMadagascarMalawiMalaysiaMaldivesMaliMaltaMarshall IslandsMauritaniaMauritiusMexicoMicronesia, Fed. Sts.Middle East & North AfricaMiddle East & North Africa (excluding high income)Middle East & North Africa (IDA & IBRD countries)Middle incomeMoldovaMongoliaMontenegroMoroccoMozambiqueMyanmarNamibiaNepalNetherlandsNew CaledoniaNew ZealandNicaraguaNigerNigeriaNorth AmericaNorwayOECD membersOmanOther small statesPacific island small statesPakistanPalauPanamaPapua New GuineaParaguayPeruPhilippinesPolandPortugalPost-demographic dividendPre-demographic dividendPuerto RicoQatarRomaniaRussian FederationRwandaSamoaSan MarinoSao Tome and PrincipeSaudi ArabiaSenegalSerbiaSeychellesSierra LeoneSingaporeSint Maarten (Dutch part)Slovak RepublicSloveniaSmall statesSolomon IslandsSomaliaSouth AfricaSouth AsiaSouth Asia (IDA & IBRD)South SudanSpainSri LankaSt. Kitts and NevisSt. LuciaSt. Martin (French part)St. Vincent and the GrenadinesSub-Saharan Africa Sub-Saharan Africa (excluding high income)Sub-Saharan Africa (IDA & IBRD countries)SudanSurinameSwazilandSwedenSwitzerlandSyrian Arab RepublicTajikistanTanzaniaThailandTimor-LesteTogoTongaTrinidad and TobagoTunisiaTurkeyTurkmenistanUgandaUkraineUnited Arab EmiratesUnited KingdomUnited StatesUpper middle incomeUruguayUzbekistanVanuatuVenezuela, RBVietnamVirgin Islands (U.S.)West Bank and GazaWorldYemen, Rep.ZambiaZimbabwe Timeline:
This timeline shows a graph from 1961 to 2015 of Brazil. No data until 1960. Number of actual observations by date: 55.
Source name:
World Development Indicators
Source organization:
(1) United Nations Population Division. World Population Prospects, (2) Census reports and other statistical publications from national statistical offices, (3) Eurostat: Demographic Statistics, (4) United Nations Statistical Division. Population and Vital Statistics Reprot (various years), (5) U.S. Census Bureau: International Database, and (6) Secretariat of the Pacific Community: Statistics and Demography Programme.
Categories, topics:
Health, Gender, Social Development
Last updated:
apr 23, 2017
Indicators value changes by year
Minimum:
52.424
jan 1, 1961
Maximum:
70.737
jan 1, 2015
At the date of observation
Value
Absolute change
Change from previous value
jan 1, 1961
52.424
+52.424
0.0%
jan 1, 1962
52.867
+0.443
0.85%
jan 1, 1963
53.302
+0.435
0.82%
jan 1, 1964
53.727
+0.425
0.8%
jan 1, 1965
54.141
+0.414
0.77%
jan 1, 1966
54.542
+0.401
0.74%
jan 1, 1967
54.933
+0.391
0.72%
jan 1, 1968
55.315
+0.382
0.7%
jan 1, 1969
55.688
+0.373
0.67%
jan 1, 1970
56.049
+0.361
0.65%
jan 1, 1971
56.394
+0.345
0.62%
jan 1, 1972
56.718
+0.324
0.57%
jan 1, 1973
57.017
+0.299
0.53%
jan 1, 1974
57.292
+0.275
0.48%
jan 1, 1975
57.545
+0.253
0.44%
jan 1, 1976
57.781
+0.236
0.41%
jan 1, 1977
58.004
+0.223
0.39%
jan 1, 1978
58.224
+0.22
0.38%
jan 1, 1979
58.445
+0.221
0.38%
jan 1, 1980
58.674
+0.229
0.39%
jan 1, 1981
58.912
+0.238
0.41%
jan 1, 1982
59.159
+0.247
0.42%
jan 1, 1983
59.412
+0.253
0.43%
jan 1, 1984
59.67
+0.258
0.43%
jan 1, 1985
59.935
+0.265
0.44%
jan 1, 1986
60.205
+0.27
0.45%
jan 1, 1987
60.479
+0.274
0.46%
jan 1, 1988
60.759
+0.28
0.46%
jan 1, 1989
61.047
+0.288
0.47%
jan 1, 1990
61.349
+0.302
0.49%
jan 1, 1991
61.673
+0.324
0.53%
jan 1, 1992
62.03
+0.357
0.58%
jan 1, 1993
62.424
+0.394
0.64%
jan 1, 1994
62.855
+0.431
0.69%
jan 1, 1995
63.32
+0.465
0.74%
jan 1, 1996
63.811
+0.491
0.78%
jan 1, 1997
64.319
+0.508
0.8%
jan 1, 1998
64.832
+0.513
0.8%
jan 1, 1999
65.337
+0.505
0.78%
jan 1, 2000
65.823
+0.486
0.74%
jan 1, 2001
66.281
+0.458
0.7%
jan 1, 2002
66.704
+0.423
0.64%
jan 1, 2003
67.095
+0.391
0.59%
jan 1, 2004
67.457
+0.362
0.54%
jan 1, 2005
67.792
+0.335
0.5%
jan 1, 2006
68.105
+0.313
0.46%
jan 1, 2007
68.401
+0.296
0.43%
jan 1, 2008
68.688
+0.287
0.42%
jan 1, 2009
68.972
+0.284
0.41%
jan 1, 2010
69.259
+0.287
0.42%
jan 1, 2011
69.55
+0.291
0.42%
jan 1, 2012
69.846
+0.296
0.43%
jan 1, 2013
70.143
+0.297
0.43%
jan 1, 2014
70.44
+0.297
0.42%
jan 1, 2015
70.737
+0.297
0.42%
Ranking of countries by current statistics by years


Comments: