29
/
en
AIzaSyAYiBZKx7MnpbEhh9jyipgxe19OcubqV5w
April 1, 2024
236003
Senegal
SEN
true
2
1
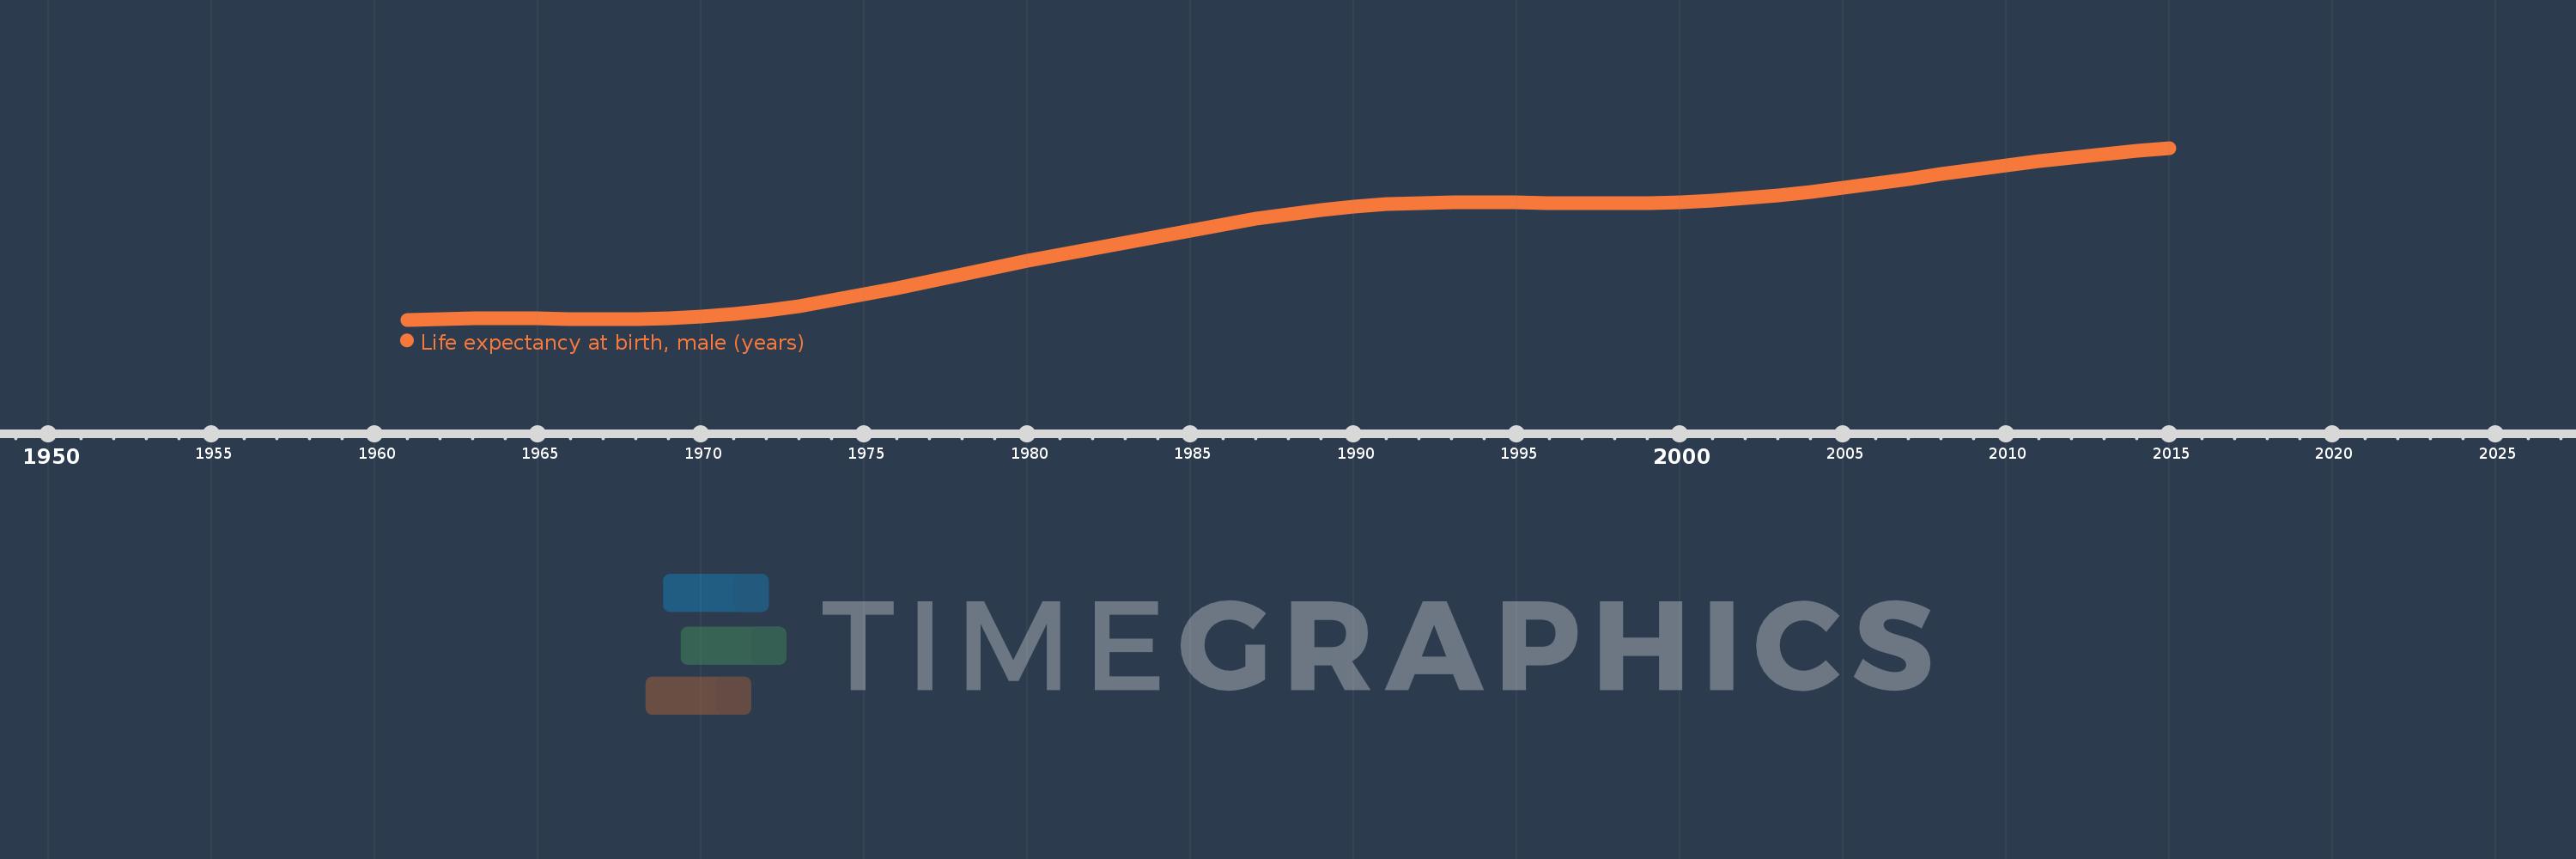
Life expectancy at birth, male (years)
2015,2014,2013,2012,2011,2010,2009,2008,2007,2006,2005,2004,2003,2002,2001,2000,1999,1998,1997,1996,1995,1994,1993,1992,1991,1990,1989,1988,1987,1986,1985,1984,1983,1982,1981,1980,1979,1978,1977,1976,1975,1974,1973,1972,1971,1970,1969,1968,1967,1966,1965,1964,1963,1962,1961
This statistics in other country:
AfghanistanAlbaniaAlgeriaAngolaAntigua and BarbudaArab WorldArgentinaArmeniaArubaAustraliaAustriaAzerbaijanBahamas, TheBahrainBangladeshBarbadosBelarusBelgiumBelizeBeninBermudaBhutanBoliviaBosnia and HerzegovinaBotswanaBrazilBrunei DarussalamBulgariaBurkina FasoBurundiCabo VerdeCambodiaCameroonCanadaCaribbean small statesCentral African RepublicCentral Europe and the BalticsChadChannel IslandsChileChinaColombiaComorosCongo, Dem. Rep.Congo, Rep.Costa RicaCote d'IvoireCroatiaCubaCuracaoCyprusCzech RepublicDenmarkDjiboutiDominicaDominican RepublicEarly-demographic dividendEast Asia & PacificEast Asia & Pacific (excluding high income)East Asia & Pacific (IDA & IBRD countries)EcuadorEgypt, Arab Rep.El SalvadorEquatorial GuineaEritreaEstoniaEthiopiaEuro areaEurope & Central AsiaEurope & Central Asia (excluding high income)Europe & Central Asia (IDA & IBRD countries)European UnionFaroe IslandsFijiFinlandFragile and conflict affected situationsFranceFrench PolynesiaGabonGambia, TheGeorgiaGermanyGhanaGreeceGreenlandGrenadaGuamGuatemalaGuineaGuinea-BissauGuyanaHaitiHeavily indebted poor countries (HIPC)High incomeHondurasHong Kong SAR, ChinaHungaryIBRD onlyIcelandIDA & IBRD totalIDA blendIDA onlyIDA totalIndiaIndonesiaIran, Islamic Rep.IraqIrelandIsle of ManIsraelItalyJamaicaJapanJordanKazakhstanKenyaKiribatiKorea, Dem. People’s Rep.Korea, Rep.KosovoKuwaitKyrgyz RepublicLao PDRLate-demographic dividendLatin America & Caribbean Latin America & Caribbean (excluding high income)Latin America & the Caribbean (IDA & IBRD countries)LatviaLeast developed countries: UN classificationLebanonLesothoLiberiaLibyaLiechtensteinLithuaniaLow & middle incomeLow incomeLower middle incomeLuxembourgMacao SAR, ChinaMacedonia, FYRMadagascarMalawiMalaysiaMaldivesMaliMaltaMarshall IslandsMauritaniaMauritiusMexicoMicronesia, Fed. Sts.Middle East & North AfricaMiddle East & North Africa (excluding high income)Middle East & North Africa (IDA & IBRD countries)Middle incomeMoldovaMongoliaMontenegroMoroccoMozambiqueMyanmarNamibiaNepalNetherlandsNew CaledoniaNew ZealandNicaraguaNigerNigeriaNorth AmericaNorwayOECD membersOmanOther small statesPacific island small statesPakistanPalauPanamaPapua New GuineaParaguayPeruPhilippinesPolandPortugalPost-demographic dividendPre-demographic dividendPuerto RicoQatarRomaniaRussian FederationRwandaSamoaSan MarinoSao Tome and PrincipeSaudi ArabiaSenegalSerbiaSeychellesSierra LeoneSingaporeSint Maarten (Dutch part)Slovak RepublicSloveniaSmall statesSolomon IslandsSomaliaSouth AfricaSouth AsiaSouth Asia (IDA & IBRD)South SudanSpainSri LankaSt. Kitts and NevisSt. LuciaSt. Martin (French part)St. Vincent and the GrenadinesSub-Saharan Africa Sub-Saharan Africa (excluding high income)Sub-Saharan Africa (IDA & IBRD countries)SudanSurinameSwazilandSwedenSwitzerlandSyrian Arab RepublicTajikistanTanzaniaThailandTimor-LesteTogoTongaTrinidad and TobagoTunisiaTurkeyTurkmenistanUgandaUkraineUnited Arab EmiratesUnited KingdomUnited StatesUpper middle incomeUruguayUzbekistanVanuatuVenezuela, RBVietnamVirgin Islands (U.S.)West Bank and GazaWorldYemen, Rep.ZambiaZimbabwe Timeline:
This timeline shows a graph from 1961 to 2015 of Senegal. No data until 1960. Number of actual observations by date: 55.
Source name:
World Development Indicators
Source organization:
(1) United Nations Population Division. World Population Prospects, (2) Census reports and other statistical publications from national statistical offices, (3) Eurostat: Demographic Statistics, (4) United Nations Statistical Division. Population and Vital Statistics Reprot (various years), (5) U.S. Census Bureau: International Database, and (6) Secretariat of the Pacific Community: Statistics and Demography Programme.
Categories, topics:
Health, Gender, Social Development
Last updated:
apr 23, 2017
Indicators value changes by year
Minimum:
37.466
jan 1, 1961
Maximum:
64.516
jan 1, 2015
At the date of observation
Value
Absolute change
Change from previous value
jan 1, 1961
37.466
+37.466
0.0%
jan 1, 1962
37.613
+0.147
0.39%
jan 1, 1963
37.686
+0.073
0.19%
jan 1, 1964
37.693
+0.007
0.02%
jan 1, 1965
37.655
-0.038
-0.1%
jan 1, 1966
37.603
-0.052
-0.14%
jan 1, 1967
37.57
-0.033
-0.09%
jan 1, 1968
37.595
+0.025
0.07%
jan 1, 1969
37.713
+0.118
0.31%
jan 1, 1970
37.952
+0.239
0.63%
jan 1, 1971
38.342
+0.39
1.03%
jan 1, 1972
38.904
+0.562
1.47%
jan 1, 1973
39.625
+0.721
1.85%
jan 1, 1974
40.479
+0.854
2.16%
jan 1, 1975
41.445
+0.966
2.39%
jan 1, 1976
42.489
+1.044
2.52%
jan 1, 1977
43.573
+1.084
2.55%
jan 1, 1978
44.661
+1.088
2.5%
jan 1, 1979
45.723
+1.062
2.38%
jan 1, 1980
46.739
+1.016
2.22%
jan 1, 1981
47.713
+0.974
2.08%
jan 1, 1982
48.665
+0.952
2.0%
jan 1, 1983
49.619
+0.954
1.96%
jan 1, 1984
50.583
+0.964
1.94%
jan 1, 1985
51.542
+0.959
1.9%
jan 1, 1986
52.47
+0.928
1.8%
jan 1, 1987
53.332
+0.862
1.64%
jan 1, 1988
54.098
+0.766
1.44%
jan 1, 1989
54.744
+0.646
1.19%
jan 1, 1990
55.257
+0.513
0.94%
jan 1, 1991
55.627
+0.37
0.67%
jan 1, 1992
55.849
+0.222
0.4%
jan 1, 1993
55.951
+0.102
0.18%
jan 1, 1994
55.966
+0.015
0.03%
jan 1, 1995
55.926
-0.04
-0.07%
jan 1, 1996
55.864
-0.062
-0.11%
jan 1, 1997
55.813
-0.051
-0.09%
jan 1, 1998
55.798
-0.015
-0.03%
jan 1, 1999
55.845
+0.047
0.08%
jan 1, 2000
55.978
+0.133
0.24%
jan 1, 2001
56.218
+0.24
0.43%
jan 1, 2002
56.578
+0.36
0.64%
jan 1, 2003
57.043
+0.465
0.82%
jan 1, 2004
57.595
+0.552
0.97%
jan 1, 2005
58.219
+0.624
1.08%
jan 1, 2006
58.899
+0.68
1.17%
jan 1, 2007
59.617
+0.718
1.22%
jan 1, 2008
60.351
+0.734
1.23%
jan 1, 2009
61.078
+0.727
1.2%
jan 1, 2010
61.778
+0.7
1.15%
jan 1, 2011
62.432
+0.654
1.06%
jan 1, 2012
63.03
+0.598
0.96%
jan 1, 2013
63.574
+0.544
0.86%
jan 1, 2014
64.069
+0.495
0.78%
jan 1, 2015
64.516
+0.447
0.7%
Ranking of countries by current statistics by years


Comments: