29
/
en
AIzaSyAYiBZKx7MnpbEhh9jyipgxe19OcubqV5w
April 1, 2024
149341
Haiti
HTI
true
2
1
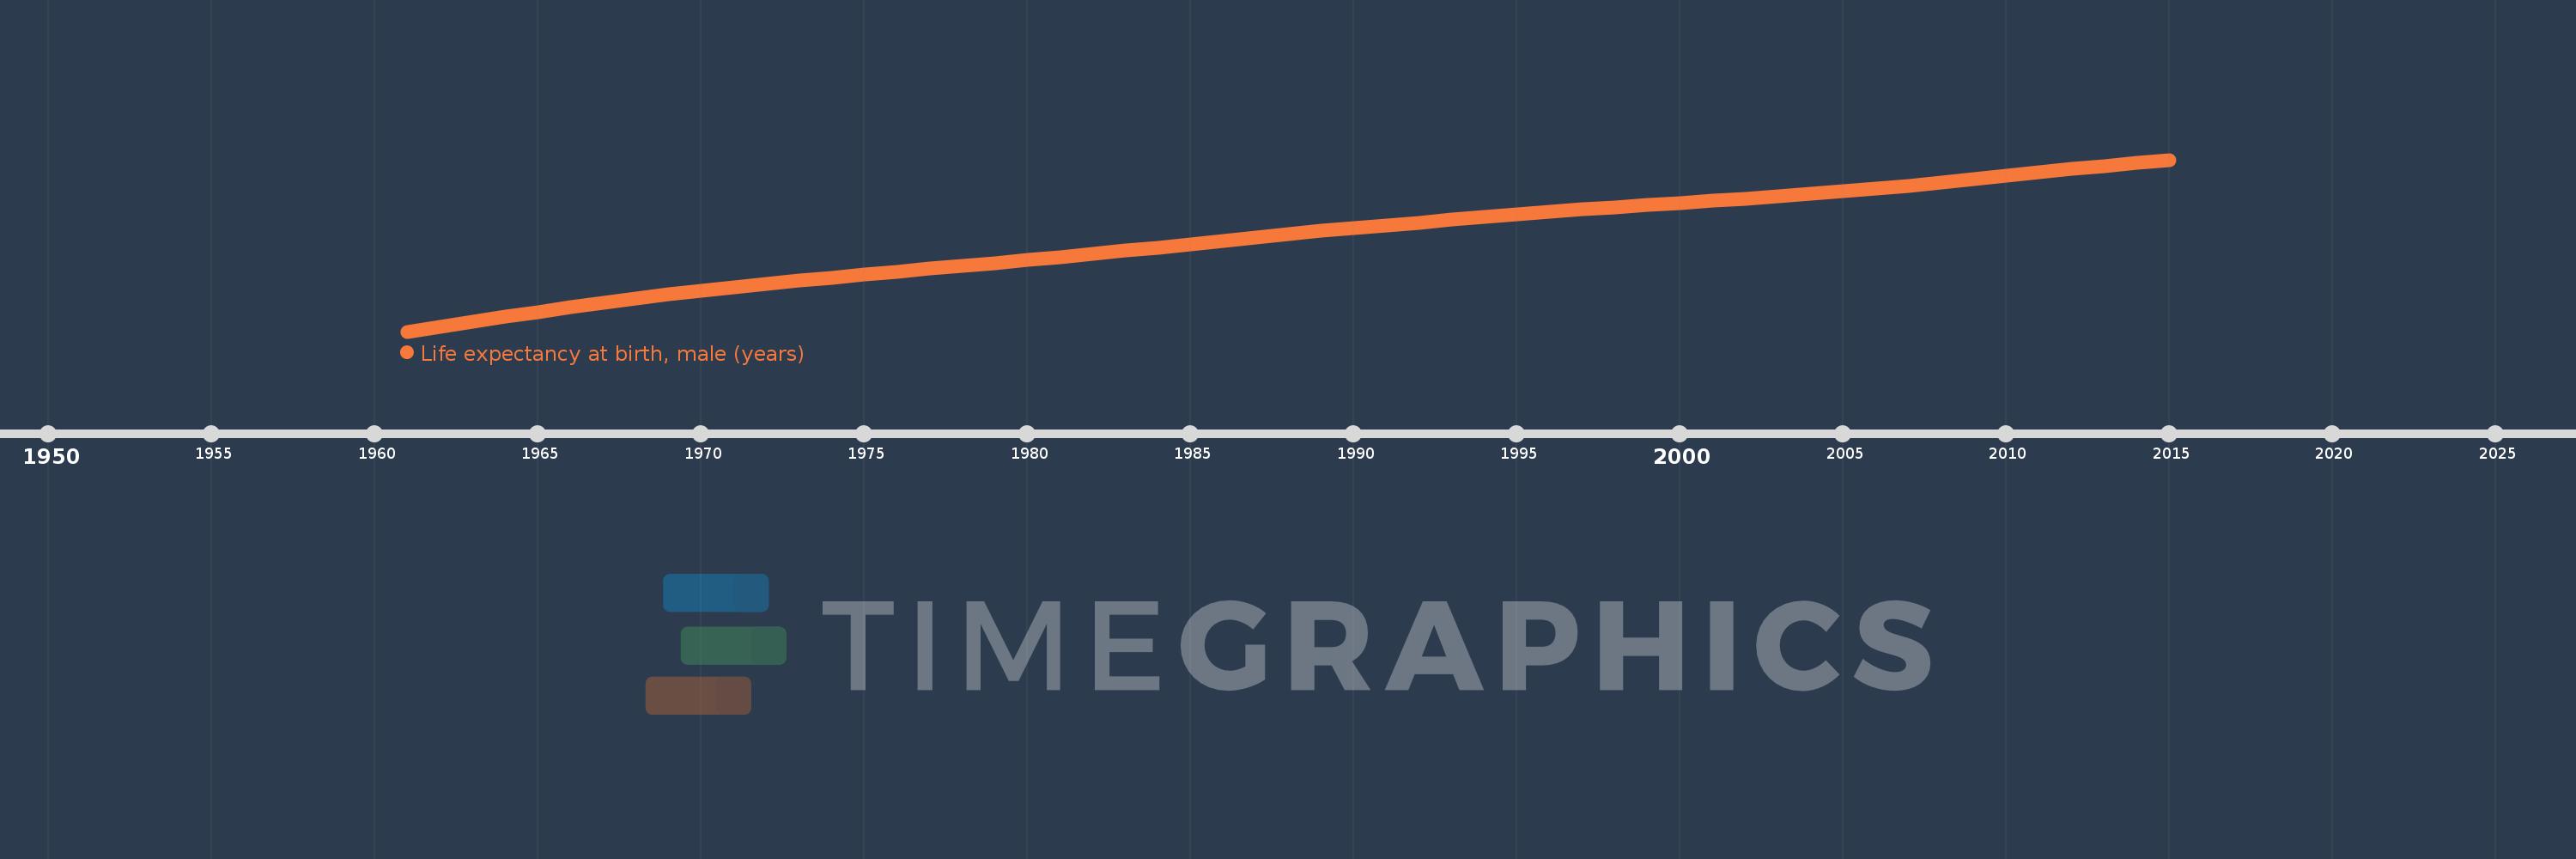
Life expectancy at birth, male (years)
2015,2014,2013,2012,2011,2010,2009,2008,2007,2006,2005,2004,2003,2002,2001,2000,1999,1998,1997,1996,1995,1994,1993,1992,1991,1990,1989,1988,1987,1986,1985,1984,1983,1982,1981,1980,1979,1978,1977,1976,1975,1974,1973,1972,1971,1970,1969,1968,1967,1966,1965,1964,1963,1962,1961
This statistics in other country:
AfghanistanAlbaniaAlgeriaAngolaAntigua and BarbudaArab WorldArgentinaArmeniaArubaAustraliaAustriaAzerbaijanBahamas, TheBahrainBangladeshBarbadosBelarusBelgiumBelizeBeninBermudaBhutanBoliviaBosnia and HerzegovinaBotswanaBrazilBrunei DarussalamBulgariaBurkina FasoBurundiCabo VerdeCambodiaCameroonCanadaCaribbean small statesCentral African RepublicCentral Europe and the BalticsChadChannel IslandsChileChinaColombiaComorosCongo, Dem. Rep.Congo, Rep.Costa RicaCote d'IvoireCroatiaCubaCuracaoCyprusCzech RepublicDenmarkDjiboutiDominicaDominican RepublicEarly-demographic dividendEast Asia & PacificEast Asia & Pacific (excluding high income)East Asia & Pacific (IDA & IBRD countries)EcuadorEgypt, Arab Rep.El SalvadorEquatorial GuineaEritreaEstoniaEthiopiaEuro areaEurope & Central AsiaEurope & Central Asia (excluding high income)Europe & Central Asia (IDA & IBRD countries)European UnionFaroe IslandsFijiFinlandFragile and conflict affected situationsFranceFrench PolynesiaGabonGambia, TheGeorgiaGermanyGhanaGreeceGreenlandGrenadaGuamGuatemalaGuineaGuinea-BissauGuyanaHaitiHeavily indebted poor countries (HIPC)High incomeHondurasHong Kong SAR, ChinaHungaryIBRD onlyIcelandIDA & IBRD totalIDA blendIDA onlyIDA totalIndiaIndonesiaIran, Islamic Rep.IraqIrelandIsle of ManIsraelItalyJamaicaJapanJordanKazakhstanKenyaKiribatiKorea, Dem. People’s Rep.Korea, Rep.KosovoKuwaitKyrgyz RepublicLao PDRLate-demographic dividendLatin America & Caribbean Latin America & Caribbean (excluding high income)Latin America & the Caribbean (IDA & IBRD countries)LatviaLeast developed countries: UN classificationLebanonLesothoLiberiaLibyaLiechtensteinLithuaniaLow & middle incomeLow incomeLower middle incomeLuxembourgMacao SAR, ChinaMacedonia, FYRMadagascarMalawiMalaysiaMaldivesMaliMaltaMarshall IslandsMauritaniaMauritiusMexicoMicronesia, Fed. Sts.Middle East & North AfricaMiddle East & North Africa (excluding high income)Middle East & North Africa (IDA & IBRD countries)Middle incomeMoldovaMongoliaMontenegroMoroccoMozambiqueMyanmarNamibiaNepalNetherlandsNew CaledoniaNew ZealandNicaraguaNigerNigeriaNorth AmericaNorwayOECD membersOmanOther small statesPacific island small statesPakistanPalauPanamaPapua New GuineaParaguayPeruPhilippinesPolandPortugalPost-demographic dividendPre-demographic dividendPuerto RicoQatarRomaniaRussian FederationRwandaSamoaSan MarinoSao Tome and PrincipeSaudi ArabiaSenegalSerbiaSeychellesSierra LeoneSingaporeSint Maarten (Dutch part)Slovak RepublicSloveniaSmall statesSolomon IslandsSomaliaSouth AfricaSouth AsiaSouth Asia (IDA & IBRD)South SudanSpainSri LankaSt. Kitts and NevisSt. LuciaSt. Martin (French part)St. Vincent and the GrenadinesSub-Saharan Africa Sub-Saharan Africa (excluding high income)Sub-Saharan Africa (IDA & IBRD countries)SudanSurinameSwazilandSwedenSwitzerlandSyrian Arab RepublicTajikistanTanzaniaThailandTimor-LesteTogoTongaTrinidad and TobagoTunisiaTurkeyTurkmenistanUgandaUkraineUnited Arab EmiratesUnited KingdomUnited StatesUpper middle incomeUruguayUzbekistanVanuatuVenezuela, RBVietnamVirgin Islands (U.S.)West Bank and GazaWorldYemen, Rep.ZambiaZimbabwe Timeline:
This timeline shows a graph from 1961 to 2015 of Haiti. No data until 1960. Number of actual observations by date: 55.
Source name:
World Development Indicators
Source organization:
(1) United Nations Population Division. World Population Prospects, (2) Census reports and other statistical publications from national statistical offices, (3) Eurostat: Demographic Statistics, (4) United Nations Statistical Division. Population and Vital Statistics Reprot (various years), (5) U.S. Census Bureau: International Database, and (6) Secretariat of the Pacific Community: Statistics and Demography Programme.
Categories, topics:
Health, Gender, Social Development
Last updated:
apr 23, 2017
Indicators value changes by year
Minimum:
40.804
jan 1, 1961
Maximum:
60.665
jan 1, 2015
At the date of observation
Value
Absolute change
Change from previous value
jan 1, 1961
40.804
+40.804
0.0%
jan 1, 1962
41.382
+0.578
1.42%
jan 1, 1963
41.956
+0.574
1.39%
jan 1, 1964
42.524
+0.568
1.35%
jan 1, 1965
43.082
+0.558
1.31%
jan 1, 1966
43.624
+0.542
1.26%
jan 1, 1967
44.143
+0.519
1.19%
jan 1, 1968
44.634
+0.491
1.11%
jan 1, 1969
45.094
+0.46
1.03%
jan 1, 1970
45.524
+0.43
0.95%
jan 1, 1971
45.926
+0.402
0.88%
jan 1, 1972
46.305
+0.379
0.83%
jan 1, 1973
46.668
+0.363
0.78%
jan 1, 1974
47.022
+0.354
0.76%
jan 1, 1975
47.371
+0.349
0.74%
jan 1, 1976
47.718
+0.347
0.73%
jan 1, 1977
48.063
+0.345
0.72%
jan 1, 1978
48.403
+0.34
0.71%
jan 1, 1979
48.74
+0.337
0.7%
jan 1, 1980
49.076
+0.336
0.69%
jan 1, 1981
49.418
+0.342
0.7%
jan 1, 1982
49.771
+0.353
0.71%
jan 1, 1983
50.139
+0.368
0.74%
jan 1, 1984
50.52
+0.381
0.76%
jan 1, 1985
50.912
+0.392
0.78%
jan 1, 1986
51.309
+0.397
0.78%
jan 1, 1987
51.701
+0.392
0.76%
jan 1, 1988
52.08
+0.379
0.73%
jan 1, 1989
52.441
+0.361
0.69%
jan 1, 1990
52.781
+0.34
0.65%
jan 1, 1991
53.102
+0.321
0.61%
jan 1, 1992
53.411
+0.309
0.58%
jan 1, 1993
53.714
+0.303
0.57%
jan 1, 1994
54.017
+0.303
0.56%
jan 1, 1995
54.321
+0.304
0.56%
jan 1, 1996
54.622
+0.301
0.55%
jan 1, 1997
54.913
+0.291
0.53%
jan 1, 1998
55.189
+0.276
0.5%
jan 1, 1999
55.45
+0.261
0.47%
jan 1, 2000
55.697
+0.247
0.45%
jan 1, 2001
55.938
+0.241
0.43%
jan 1, 2002
56.181
+0.243
0.43%
jan 1, 2003
56.434
+0.253
0.45%
jan 1, 2004
56.705
+0.271
0.48%
jan 1, 2005
56.998
+0.293
0.52%
jan 1, 2006
57.317
+0.319
0.56%
jan 1, 2007
57.664
+0.347
0.61%
jan 1, 2008
58.033
+0.369
0.64%
jan 1, 2009
58.417
+0.384
0.66%
jan 1, 2010
58.811
+0.394
0.67%
jan 1, 2011
59.205
+0.394
0.67%
jan 1, 2012
59.593
+0.388
0.66%
jan 1, 2013
59.969
+0.376
0.63%
jan 1, 2014
60.327
+0.358
0.6%
jan 1, 2015
60.665
+0.338
0.56%
Ranking of countries by current statistics by years


Comments: