29
/
en
AIzaSyAYiBZKx7MnpbEhh9jyipgxe19OcubqV5w
April 1, 2024
281217
Venezuela, RB
VEN
true
2
1
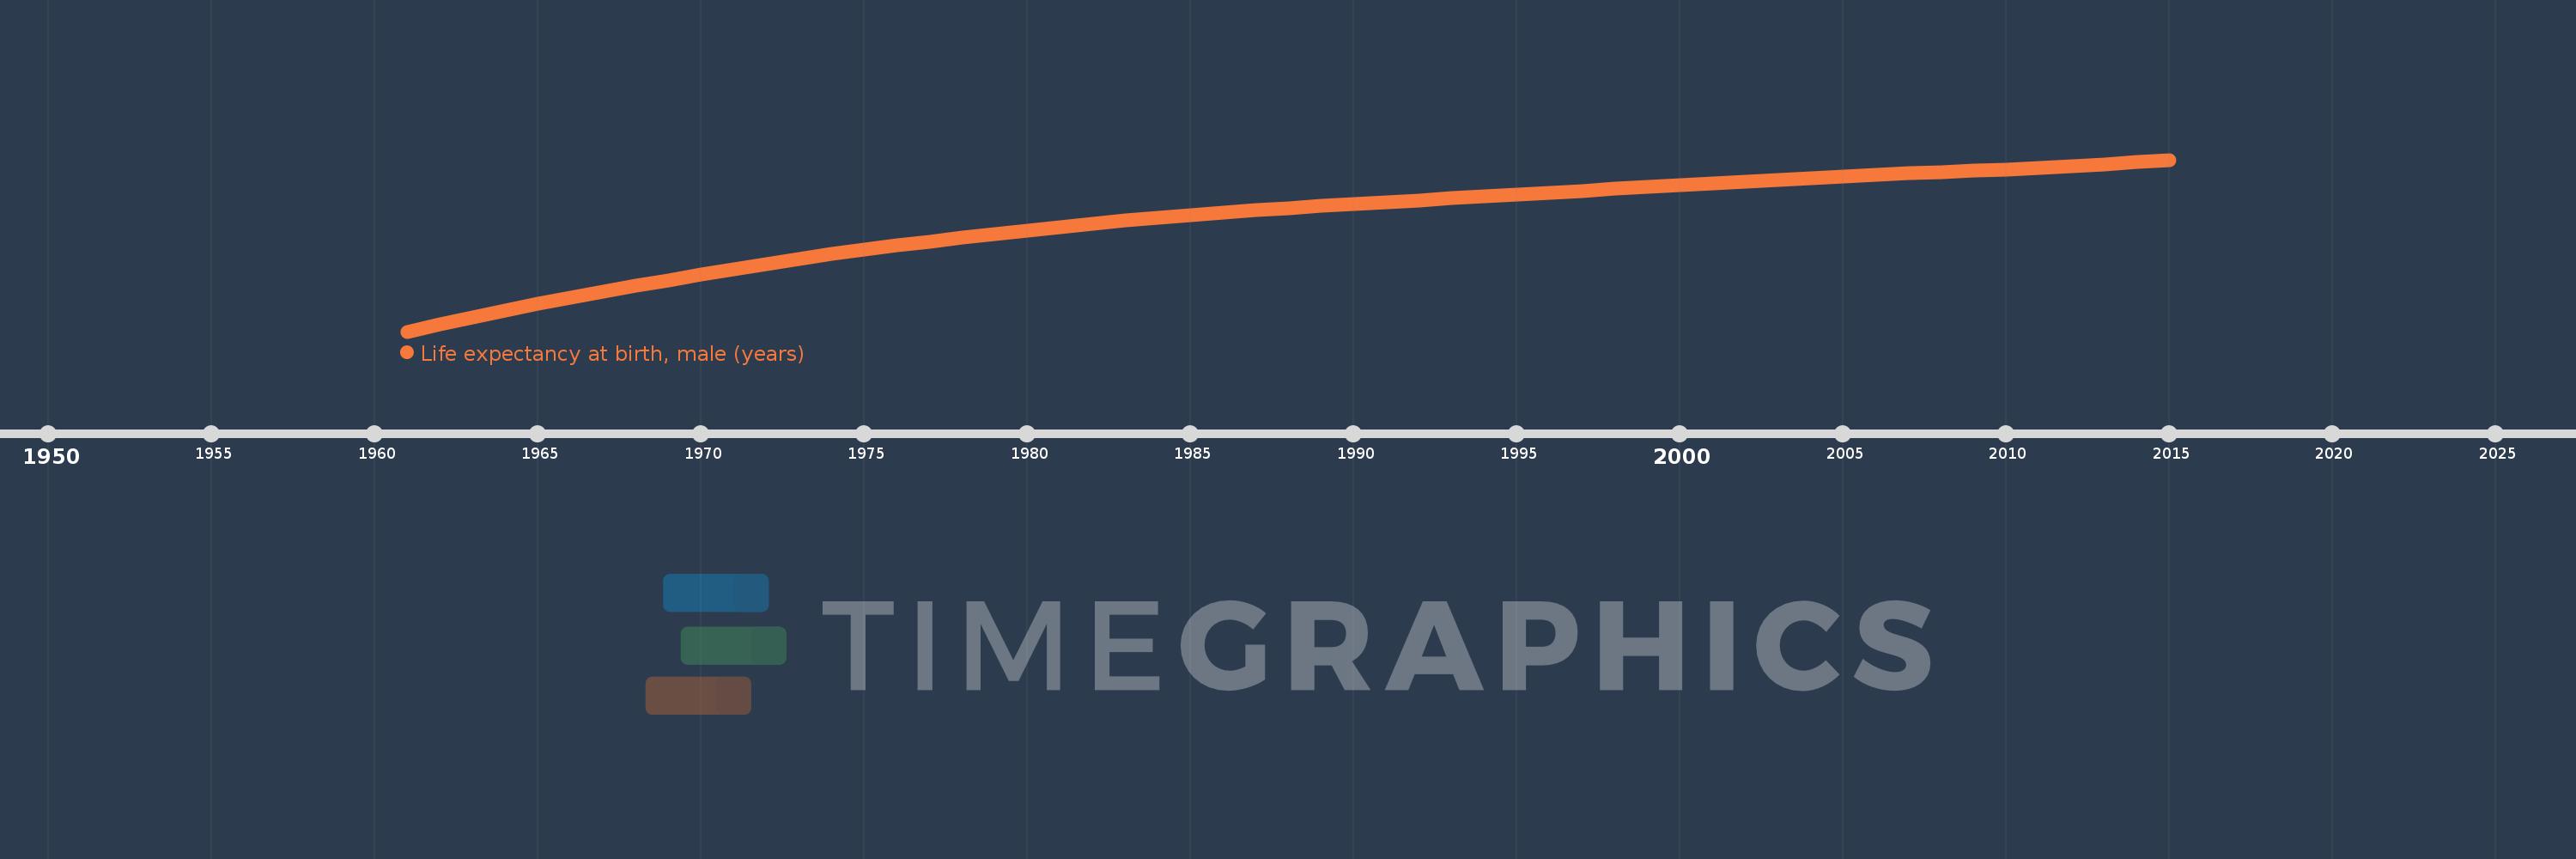
Life expectancy at birth, male (years)
2015,2014,2013,2012,2011,2010,2009,2008,2007,2006,2005,2004,2003,2002,2001,2000,1999,1998,1997,1996,1995,1994,1993,1992,1991,1990,1989,1988,1987,1986,1985,1984,1983,1982,1981,1980,1979,1978,1977,1976,1975,1974,1973,1972,1971,1970,1969,1968,1967,1966,1965,1964,1963,1962,1961
This statistics in other country:
AfghanistanAlbaniaAlgeriaAngolaAntigua and BarbudaArab WorldArgentinaArmeniaArubaAustraliaAustriaAzerbaijanBahamas, TheBahrainBangladeshBarbadosBelarusBelgiumBelizeBeninBermudaBhutanBoliviaBosnia and HerzegovinaBotswanaBrazilBrunei DarussalamBulgariaBurkina FasoBurundiCabo VerdeCambodiaCameroonCanadaCaribbean small statesCentral African RepublicCentral Europe and the BalticsChadChannel IslandsChileChinaColombiaComorosCongo, Dem. Rep.Congo, Rep.Costa RicaCote d'IvoireCroatiaCubaCuracaoCyprusCzech RepublicDenmarkDjiboutiDominicaDominican RepublicEarly-demographic dividendEast Asia & PacificEast Asia & Pacific (excluding high income)East Asia & Pacific (IDA & IBRD countries)EcuadorEgypt, Arab Rep.El SalvadorEquatorial GuineaEritreaEstoniaEthiopiaEuro areaEurope & Central AsiaEurope & Central Asia (excluding high income)Europe & Central Asia (IDA & IBRD countries)European UnionFaroe IslandsFijiFinlandFragile and conflict affected situationsFranceFrench PolynesiaGabonGambia, TheGeorgiaGermanyGhanaGreeceGreenlandGrenadaGuamGuatemalaGuineaGuinea-BissauGuyanaHaitiHeavily indebted poor countries (HIPC)High incomeHondurasHong Kong SAR, ChinaHungaryIBRD onlyIcelandIDA & IBRD totalIDA blendIDA onlyIDA totalIndiaIndonesiaIran, Islamic Rep.IraqIrelandIsle of ManIsraelItalyJamaicaJapanJordanKazakhstanKenyaKiribatiKorea, Dem. People’s Rep.Korea, Rep.KosovoKuwaitKyrgyz RepublicLao PDRLate-demographic dividendLatin America & Caribbean Latin America & Caribbean (excluding high income)Latin America & the Caribbean (IDA & IBRD countries)LatviaLeast developed countries: UN classificationLebanonLesothoLiberiaLibyaLiechtensteinLithuaniaLow & middle incomeLow incomeLower middle incomeLuxembourgMacao SAR, ChinaMacedonia, FYRMadagascarMalawiMalaysiaMaldivesMaliMaltaMarshall IslandsMauritaniaMauritiusMexicoMicronesia, Fed. Sts.Middle East & North AfricaMiddle East & North Africa (excluding high income)Middle East & North Africa (IDA & IBRD countries)Middle incomeMoldovaMongoliaMontenegroMoroccoMozambiqueMyanmarNamibiaNepalNetherlandsNew CaledoniaNew ZealandNicaraguaNigerNigeriaNorth AmericaNorwayOECD membersOmanOther small statesPacific island small statesPakistanPalauPanamaPapua New GuineaParaguayPeruPhilippinesPolandPortugalPost-demographic dividendPre-demographic dividendPuerto RicoQatarRomaniaRussian FederationRwandaSamoaSan MarinoSao Tome and PrincipeSaudi ArabiaSenegalSerbiaSeychellesSierra LeoneSingaporeSint Maarten (Dutch part)Slovak RepublicSloveniaSmall statesSolomon IslandsSomaliaSouth AfricaSouth AsiaSouth Asia (IDA & IBRD)South SudanSpainSri LankaSt. Kitts and NevisSt. LuciaSt. Martin (French part)St. Vincent and the GrenadinesSub-Saharan Africa Sub-Saharan Africa (excluding high income)Sub-Saharan Africa (IDA & IBRD countries)SudanSurinameSwazilandSwedenSwitzerlandSyrian Arab RepublicTajikistanTanzaniaThailandTimor-LesteTogoTongaTrinidad and TobagoTunisiaTurkeyTurkmenistanUgandaUkraineUnited Arab EmiratesUnited KingdomUnited StatesUpper middle incomeUruguayUzbekistanVanuatuVenezuela, RBVietnamVirgin Islands (U.S.)West Bank and GazaWorldYemen, Rep.ZambiaZimbabwe Timeline:
This timeline shows a graph from 1961 to 2015 of Venezuela, RB. No data until 1960. Number of actual observations by date: 55.
Source name:
World Development Indicators
Source organization:
(1) United Nations Population Division. World Population Prospects, (2) Census reports and other statistical publications from national statistical offices, (3) Eurostat: Demographic Statistics, (4) United Nations Statistical Division. Population and Vital Statistics Reprot (various years), (5) U.S. Census Bureau: International Database, and (6) Secretariat of the Pacific Community: Statistics and Demography Programme.
Categories, topics:
Health, Gender, Social Development
Last updated:
apr 23, 2017
Indicators value changes by year
Maximum:
70.204
jan 1, 2015
At the date of observation
Value
Absolute change
Change from previous value
jan 1, 1961
57.69
+57.69
0.0%
jan 1, 1962
58.225
+0.535
0.93%
jan 1, 1963
58.743
+0.518
0.89%
jan 1, 1964
59.239
+0.496
0.84%
jan 1, 1965
59.712
+0.473
0.8%
jan 1, 1966
60.165
+0.453
0.76%
jan 1, 1967
60.601
+0.436
0.72%
jan 1, 1968
61.025
+0.424
0.7%
jan 1, 1969
61.44
+0.415
0.68%
jan 1, 1970
61.847
+0.407
0.66%
jan 1, 1971
62.243
+0.396
0.64%
jan 1, 1972
62.625
+0.382
0.61%
jan 1, 1973
62.988
+0.363
0.58%
jan 1, 1974
63.33
+0.342
0.54%
jan 1, 1975
63.652
+0.322
0.51%
jan 1, 1976
63.956
+0.304
0.48%
jan 1, 1977
64.245
+0.289
0.45%
jan 1, 1978
64.524
+0.279
0.43%
jan 1, 1979
64.795
+0.271
0.42%
jan 1, 1980
65.059
+0.264
0.41%
jan 1, 1981
65.314
+0.255
0.39%
jan 1, 1982
65.557
+0.243
0.37%
jan 1, 1983
65.786
+0.229
0.35%
jan 1, 1984
65.997
+0.211
0.32%
jan 1, 1985
66.191
+0.194
0.29%
jan 1, 1986
66.369
+0.178
0.27%
jan 1, 1987
66.533
+0.164
0.25%
jan 1, 1988
66.687
+0.154
0.23%
jan 1, 1989
66.833
+0.146
0.22%
jan 1, 1990
66.974
+0.141
0.21%
jan 1, 1991
67.113
+0.139
0.21%
jan 1, 1992
67.251
+0.138
0.21%
jan 1, 1993
67.389
+0.138
0.21%
jan 1, 1994
67.527
+0.138
0.2%
jan 1, 1995
67.665
+0.138
0.2%
jan 1, 1996
67.804
+0.139
0.21%
jan 1, 1997
67.944
+0.14
0.21%
jan 1, 1998
68.083
+0.139
0.2%
jan 1, 1999
68.221
+0.138
0.2%
jan 1, 2000
68.357
+0.136
0.2%
jan 1, 2001
68.491
+0.134
0.2%
jan 1, 2002
68.62
+0.129
0.19%
jan 1, 2003
68.746
+0.126
0.18%
jan 1, 2004
68.867
+0.121
0.18%
jan 1, 2005
68.984
+0.117
0.17%
jan 1, 2006
69.096
+0.112
0.16%
jan 1, 2007
69.203
+0.107
0.15%
jan 1, 2008
69.305
+0.102
0.15%
jan 1, 2009
69.406
+0.101
0.15%
jan 1, 2010
69.508
+0.102
0.15%
jan 1, 2011
69.616
+0.108
0.16%
jan 1, 2012
69.738
+0.122
0.18%
jan 1, 2013
69.875
+0.137
0.2%
jan 1, 2014
70.031
+0.156
0.22%
jan 1, 2015
70.204
+0.173
0.25%
Ranking of countries by current statistics by years


Comments: