29
/
en
AIzaSyAYiBZKx7MnpbEhh9jyipgxe19OcubqV5w
April 1, 2024
263694
Timor-Leste
TLS
true
2
1
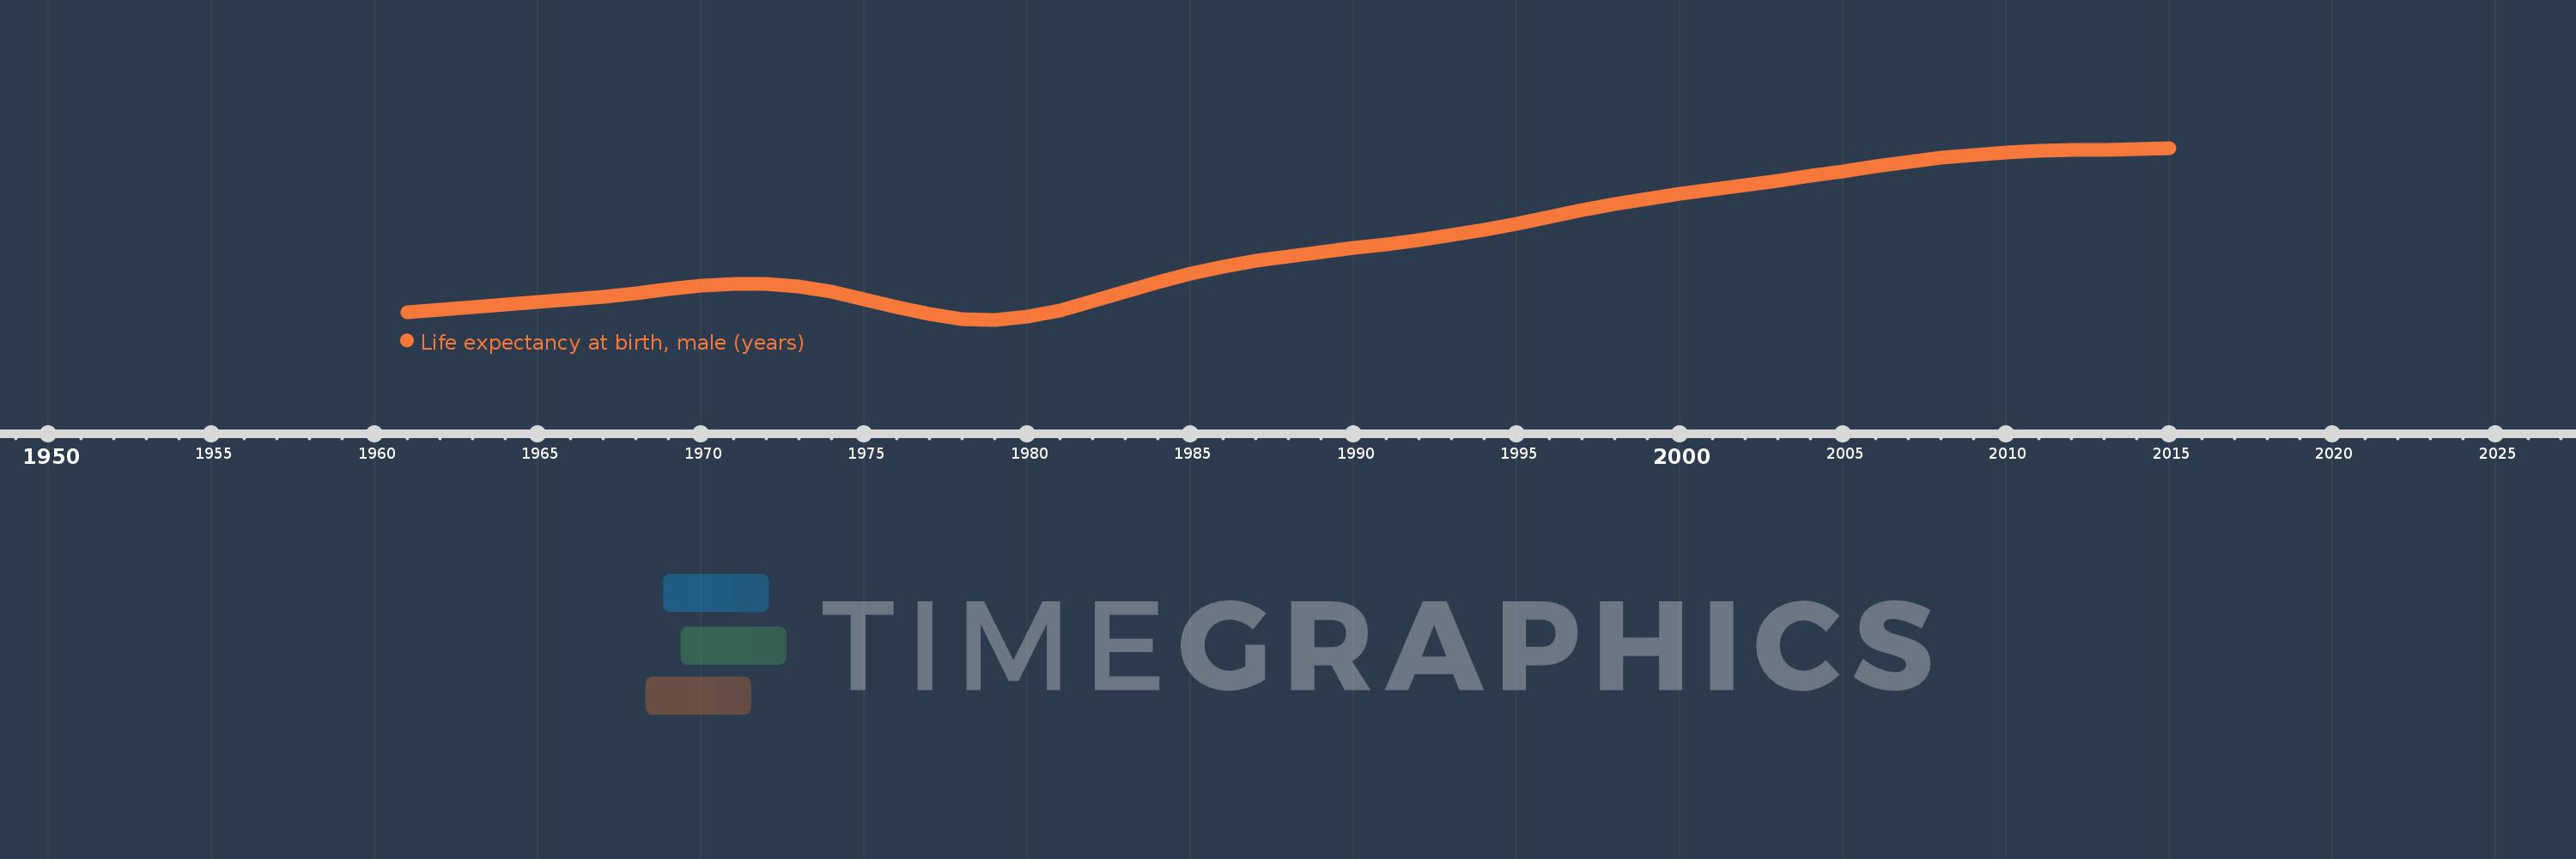
Life expectancy at birth, male (years)
2015,2014,2013,2012,2011,2010,2009,2008,2007,2006,2005,2004,2003,2002,2001,2000,1999,1998,1997,1996,1995,1994,1993,1992,1991,1990,1989,1988,1987,1986,1985,1984,1983,1982,1981,1980,1979,1978,1977,1976,1975,1974,1973,1972,1971,1970,1969,1968,1967,1966,1965,1964,1963,1962,1961
This statistics in other country:
AfghanistanAlbaniaAlgeriaAngolaAntigua and BarbudaArab WorldArgentinaArmeniaArubaAustraliaAustriaAzerbaijanBahamas, TheBahrainBangladeshBarbadosBelarusBelgiumBelizeBeninBermudaBhutanBoliviaBosnia and HerzegovinaBotswanaBrazilBrunei DarussalamBulgariaBurkina FasoBurundiCabo VerdeCambodiaCameroonCanadaCaribbean small statesCentral African RepublicCentral Europe and the BalticsChadChannel IslandsChileChinaColombiaComorosCongo, Dem. Rep.Congo, Rep.Costa RicaCote d'IvoireCroatiaCubaCuracaoCyprusCzech RepublicDenmarkDjiboutiDominicaDominican RepublicEarly-demographic dividendEast Asia & PacificEast Asia & Pacific (excluding high income)East Asia & Pacific (IDA & IBRD countries)EcuadorEgypt, Arab Rep.El SalvadorEquatorial GuineaEritreaEstoniaEthiopiaEuro areaEurope & Central AsiaEurope & Central Asia (excluding high income)Europe & Central Asia (IDA & IBRD countries)European UnionFaroe IslandsFijiFinlandFragile and conflict affected situationsFranceFrench PolynesiaGabonGambia, TheGeorgiaGermanyGhanaGreeceGreenlandGrenadaGuamGuatemalaGuineaGuinea-BissauGuyanaHaitiHeavily indebted poor countries (HIPC)High incomeHondurasHong Kong SAR, ChinaHungaryIBRD onlyIcelandIDA & IBRD totalIDA blendIDA onlyIDA totalIndiaIndonesiaIran, Islamic Rep.IraqIrelandIsle of ManIsraelItalyJamaicaJapanJordanKazakhstanKenyaKiribatiKorea, Dem. People’s Rep.Korea, Rep.KosovoKuwaitKyrgyz RepublicLao PDRLate-demographic dividendLatin America & Caribbean Latin America & Caribbean (excluding high income)Latin America & the Caribbean (IDA & IBRD countries)LatviaLeast developed countries: UN classificationLebanonLesothoLiberiaLibyaLiechtensteinLithuaniaLow & middle incomeLow incomeLower middle incomeLuxembourgMacao SAR, ChinaMacedonia, FYRMadagascarMalawiMalaysiaMaldivesMaliMaltaMarshall IslandsMauritaniaMauritiusMexicoMicronesia, Fed. Sts.Middle East & North AfricaMiddle East & North Africa (excluding high income)Middle East & North Africa (IDA & IBRD countries)Middle incomeMoldovaMongoliaMontenegroMoroccoMozambiqueMyanmarNamibiaNepalNetherlandsNew CaledoniaNew ZealandNicaraguaNigerNigeriaNorth AmericaNorwayOECD membersOmanOther small statesPacific island small statesPakistanPalauPanamaPapua New GuineaParaguayPeruPhilippinesPolandPortugalPost-demographic dividendPre-demographic dividendPuerto RicoQatarRomaniaRussian FederationRwandaSamoaSan MarinoSao Tome and PrincipeSaudi ArabiaSenegalSerbiaSeychellesSierra LeoneSingaporeSint Maarten (Dutch part)Slovak RepublicSloveniaSmall statesSolomon IslandsSomaliaSouth AfricaSouth AsiaSouth Asia (IDA & IBRD)South SudanSpainSri LankaSt. Kitts and NevisSt. LuciaSt. Martin (French part)St. Vincent and the GrenadinesSub-Saharan Africa Sub-Saharan Africa (excluding high income)Sub-Saharan Africa (IDA & IBRD countries)SudanSurinameSwazilandSwedenSwitzerlandSyrian Arab RepublicTajikistanTanzaniaThailandTimor-LesteTogoTongaTrinidad and TobagoTunisiaTurkeyTurkmenistanUgandaUkraineUnited Arab EmiratesUnited KingdomUnited StatesUpper middle incomeUruguayUzbekistanVanuatuVenezuela, RBVietnamVirgin Islands (U.S.)West Bank and GazaWorldYemen, Rep.ZambiaZimbabwe Timeline:
This timeline shows a graph from 1961 to 2015 of Timor-Leste. No data until 1960. Number of actual observations by date: 55.
Source name:
World Development Indicators
Source organization:
(1) United Nations Population Division. World Population Prospects, (2) Census reports and other statistical publications from national statistical offices, (3) Eurostat: Demographic Statistics, (4) United Nations Statistical Division. Population and Vital Statistics Reprot (various years), (5) U.S. Census Bureau: International Database, and (6) Secretariat of the Pacific Community: Statistics and Demography Programme.
Categories, topics:
Health, Gender, Social Development
Last updated:
apr 23, 2017
Indicators value changes by year
Minimum:
31.581
jan 1, 1979
Maximum:
66.545
jan 1, 2015
At the date of observation
Value
Absolute change
Change from previous value
jan 1, 1961
33.182
+33.182
0.0%
jan 1, 1962
33.68
+0.498
1.5%
jan 1, 1963
34.181
+0.501
1.49%
jan 1, 1964
34.683
+0.502
1.47%
jan 1, 1965
35.183
+0.5
1.44%
jan 1, 1966
35.719
+0.536
1.52%
jan 1, 1967
36.336
+0.617
1.73%
jan 1, 1968
37.031
+0.695
1.91%
jan 1, 1969
37.761
+0.73
1.97%
jan 1, 1970
38.452
+0.691
1.83%
jan 1, 1971
38.914
+0.462
1.2%
jan 1, 1972
38.915
+0.001
0.0%
jan 1, 1973
38.362
-0.553
-1.42%
jan 1, 1974
37.273
-1.089
-2.84%
jan 1, 1975
35.764
-1.509
-4.05%
jan 1, 1976
34.11
-1.654
-4.62%
jan 1, 1977
32.671
-1.439
-4.22%
jan 1, 1978
31.761
-0.91
-2.79%
jan 1, 1979
31.581
-0.18
-0.57%
jan 1, 1980
32.183
+0.602
1.91%
jan 1, 1981
33.494
+1.311
4.07%
jan 1, 1982
35.319
+1.825
5.45%
jan 1, 1983
37.335
+2.016
5.71%
jan 1, 1984
39.27
+1.935
5.18%
jan 1, 1985
40.998
+1.728
4.4%
jan 1, 1986
42.434
+1.436
3.5%
jan 1, 1987
43.567
+1.133
2.67%
jan 1, 1988
44.504
+0.937
2.15%
jan 1, 1989
45.346
+0.842
1.89%
jan 1, 1990
46.135
+0.789
1.74%
jan 1, 1991
46.934
+0.799
1.73%
jan 1, 1992
47.815
+0.881
1.88%
jan 1, 1993
48.811
+0.996
2.08%
jan 1, 1994
49.935
+1.124
2.3%
jan 1, 1995
51.18
+1.245
2.49%
jan 1, 1996
52.501
+1.321
2.58%
jan 1, 1997
53.828
+1.327
2.53%
jan 1, 1998
55.086
+1.258
2.34%
jan 1, 1999
56.226
+1.14
2.07%
jan 1, 2000
57.236
+1.01
1.8%
jan 1, 2001
58.146
+0.91
1.59%
jan 1, 2002
59.014
+0.868
1.49%
jan 1, 2003
59.903
+0.889
1.51%
jan 1, 2004
60.844
+0.941
1.57%
jan 1, 2005
61.832
+0.988
1.62%
jan 1, 2006
62.82
+0.988
1.6%
jan 1, 2007
63.742
+0.922
1.47%
jan 1, 2008
64.532
+0.79
1.24%
jan 1, 2009
65.151
+0.619
0.96%
jan 1, 2010
65.594
+0.443
0.68%
jan 1, 2011
65.884
+0.29
0.44%
jan 1, 2012
66.066
+0.182
0.28%
jan 1, 2013
66.206
+0.14
0.21%
jan 1, 2014
66.357
+0.151
0.23%
jan 1, 2015
66.545
+0.188
0.28%
Ranking of countries by current statistics by years


Comments: