29
/
en
AIzaSyAYiBZKx7MnpbEhh9jyipgxe19OcubqV5w
April 1, 2024
287435
Zimbabwe
ZWE
true
2
1
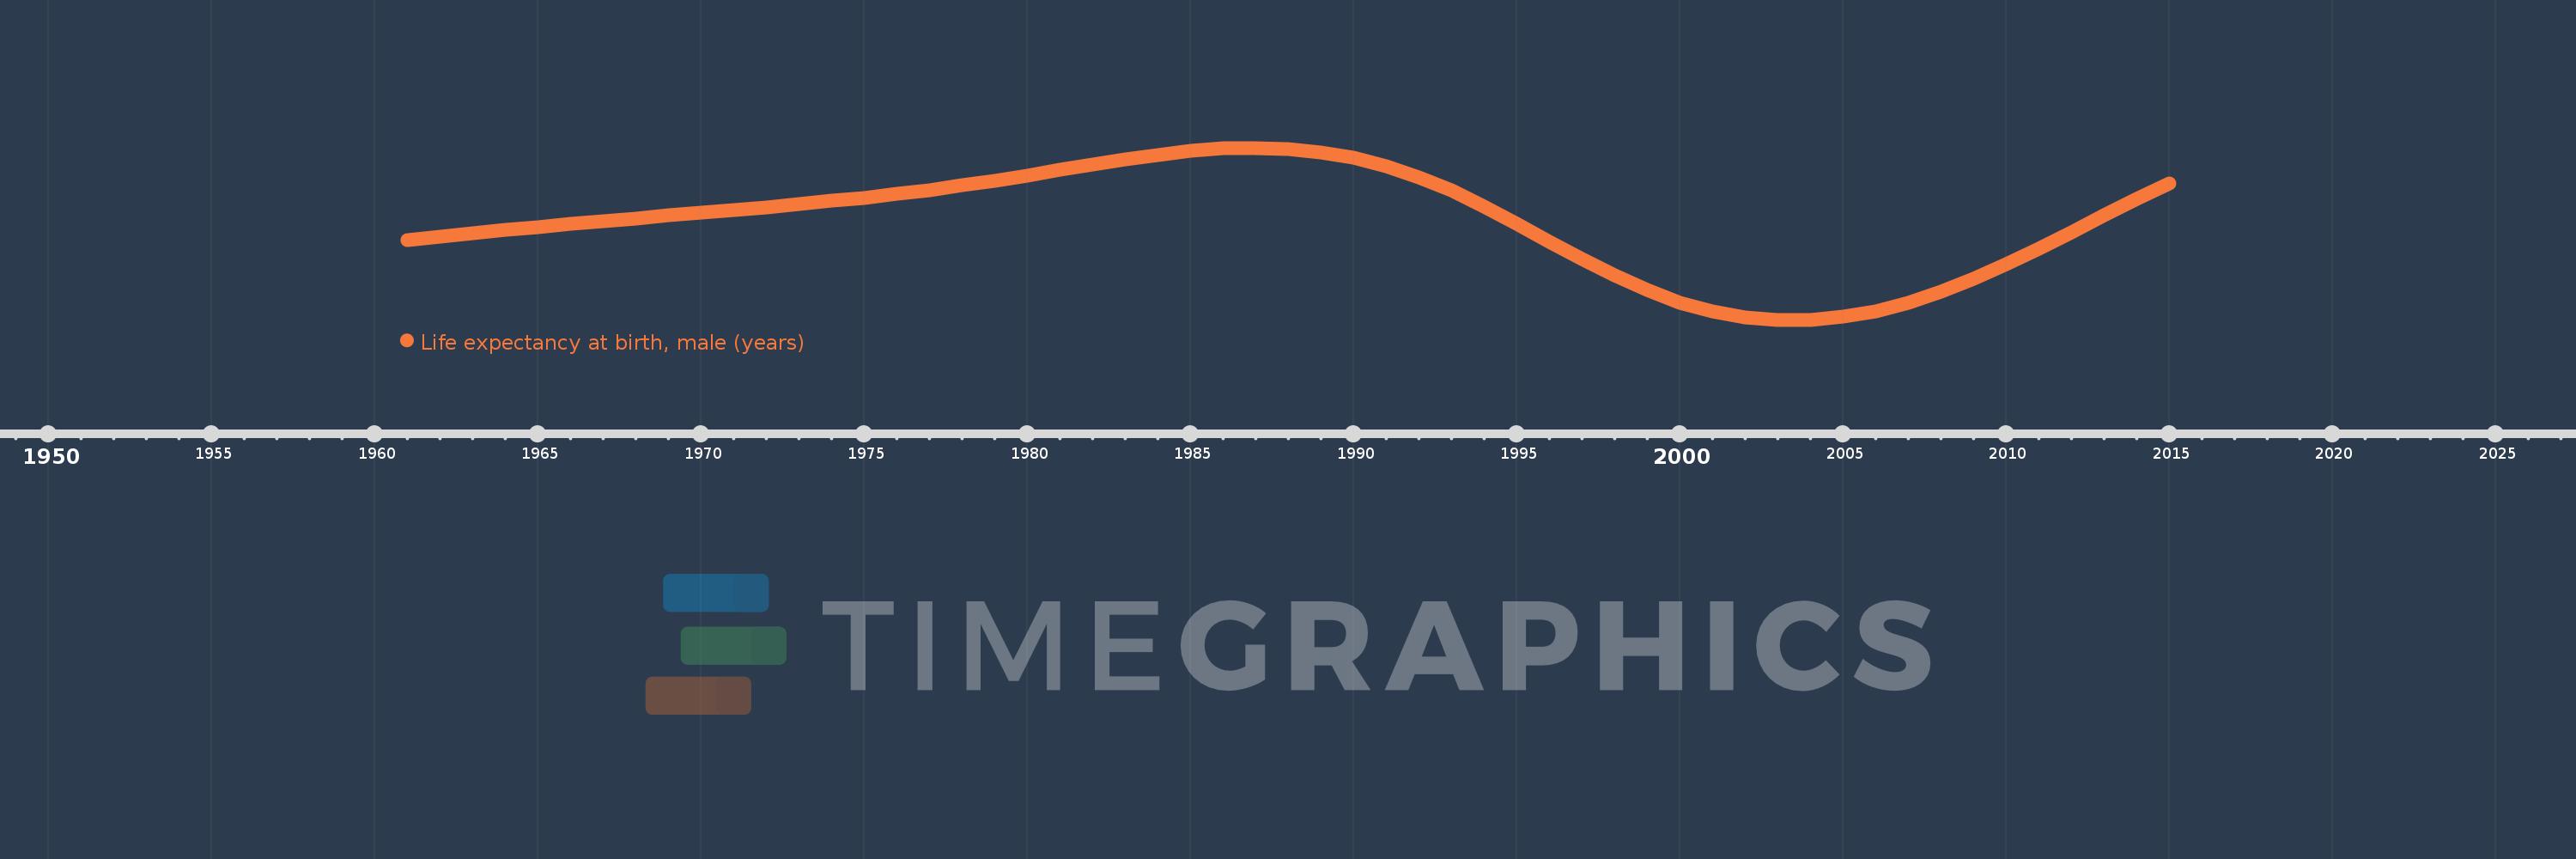
Life expectancy at birth, male (years)
2015,2014,2013,2012,2011,2010,2009,2008,2007,2006,2005,2004,2003,2002,2001,2000,1999,1998,1997,1996,1995,1994,1993,1992,1991,1990,1989,1988,1987,1986,1985,1984,1983,1982,1981,1980,1979,1978,1977,1976,1975,1974,1973,1972,1971,1970,1969,1968,1967,1966,1965,1964,1963,1962,1961
This statistics in other country:
AfghanistanAlbaniaAlgeriaAngolaAntigua and BarbudaArab WorldArgentinaArmeniaArubaAustraliaAustriaAzerbaijanBahamas, TheBahrainBangladeshBarbadosBelarusBelgiumBelizeBeninBermudaBhutanBoliviaBosnia and HerzegovinaBotswanaBrazilBrunei DarussalamBulgariaBurkina FasoBurundiCabo VerdeCambodiaCameroonCanadaCaribbean small statesCentral African RepublicCentral Europe and the BalticsChadChannel IslandsChileChinaColombiaComorosCongo, Dem. Rep.Congo, Rep.Costa RicaCote d'IvoireCroatiaCubaCuracaoCyprusCzech RepublicDenmarkDjiboutiDominicaDominican RepublicEarly-demographic dividendEast Asia & PacificEast Asia & Pacific (excluding high income)East Asia & Pacific (IDA & IBRD countries)EcuadorEgypt, Arab Rep.El SalvadorEquatorial GuineaEritreaEstoniaEthiopiaEuro areaEurope & Central AsiaEurope & Central Asia (excluding high income)Europe & Central Asia (IDA & IBRD countries)European UnionFaroe IslandsFijiFinlandFragile and conflict affected situationsFranceFrench PolynesiaGabonGambia, TheGeorgiaGermanyGhanaGreeceGreenlandGrenadaGuamGuatemalaGuineaGuinea-BissauGuyanaHaitiHeavily indebted poor countries (HIPC)High incomeHondurasHong Kong SAR, ChinaHungaryIBRD onlyIcelandIDA & IBRD totalIDA blendIDA onlyIDA totalIndiaIndonesiaIran, Islamic Rep.IraqIrelandIsle of ManIsraelItalyJamaicaJapanJordanKazakhstanKenyaKiribatiKorea, Dem. People’s Rep.Korea, Rep.KosovoKuwaitKyrgyz RepublicLao PDRLate-demographic dividendLatin America & Caribbean Latin America & Caribbean (excluding high income)Latin America & the Caribbean (IDA & IBRD countries)LatviaLeast developed countries: UN classificationLebanonLesothoLiberiaLibyaLiechtensteinLithuaniaLow & middle incomeLow incomeLower middle incomeLuxembourgMacao SAR, ChinaMacedonia, FYRMadagascarMalawiMalaysiaMaldivesMaliMaltaMarshall IslandsMauritaniaMauritiusMexicoMicronesia, Fed. Sts.Middle East & North AfricaMiddle East & North Africa (excluding high income)Middle East & North Africa (IDA & IBRD countries)Middle incomeMoldovaMongoliaMontenegroMoroccoMozambiqueMyanmarNamibiaNepalNetherlandsNew CaledoniaNew ZealandNicaraguaNigerNigeriaNorth AmericaNorwayOECD membersOmanOther small statesPacific island small statesPakistanPalauPanamaPapua New GuineaParaguayPeruPhilippinesPolandPortugalPost-demographic dividendPre-demographic dividendPuerto RicoQatarRomaniaRussian FederationRwandaSamoaSan MarinoSao Tome and PrincipeSaudi ArabiaSenegalSerbiaSeychellesSierra LeoneSingaporeSint Maarten (Dutch part)Slovak RepublicSloveniaSmall statesSolomon IslandsSomaliaSouth AfricaSouth AsiaSouth Asia (IDA & IBRD)South SudanSpainSri LankaSt. Kitts and NevisSt. LuciaSt. Martin (French part)St. Vincent and the GrenadinesSub-Saharan Africa Sub-Saharan Africa (excluding high income)Sub-Saharan Africa (IDA & IBRD countries)SudanSurinameSwazilandSwedenSwitzerlandSyrian Arab RepublicTajikistanTanzaniaThailandTimor-LesteTogoTongaTrinidad and TobagoTunisiaTurkeyTurkmenistanUgandaUkraineUnited Arab EmiratesUnited KingdomUnited StatesUpper middle incomeUruguayUzbekistanVanuatuVenezuela, RBVietnamVirgin Islands (U.S.)West Bank and GazaWorldYemen, Rep.ZambiaZimbabwe Timeline:
This timeline shows a graph from 1961 to 2015 of Zimbabwe. No data until 1960. Number of actual observations by date: 55.
Source name:
World Development Indicators
Source organization:
(1) United Nations Population Division. World Population Prospects, (2) Census reports and other statistical publications from national statistical offices, (3) Eurostat: Demographic Statistics, (4) United Nations Statistical Division. Population and Vital Statistics Reprot (various years), (5) U.S. Census Bureau: International Database, and (6) Secretariat of the Pacific Community: Statistics and Demography Programme.
Categories, topics:
Health, Gender, Social Development
Last updated:
apr 23, 2017
Indicators value changes by year
Minimum:
41.265
jan 1, 2003
Maximum:
60.038
jan 1, 1987
At the date of observation
Value
Absolute change
Change from previous value
jan 1, 1961
49.981
+49.981
0.0%
jan 1, 1962
50.353
+0.372
0.74%
jan 1, 1963
50.714
+0.361
0.72%
jan 1, 1964
51.062
+0.348
0.69%
jan 1, 1965
51.398
+0.336
0.66%
jan 1, 1966
51.723
+0.325
0.63%
jan 1, 1967
52.036
+0.313
0.61%
jan 1, 1968
52.343
+0.307
0.59%
jan 1, 1969
52.646
+0.303
0.58%
jan 1, 1970
52.951
+0.305
0.58%
jan 1, 1971
53.262
+0.311
0.59%
jan 1, 1972
53.58
+0.318
0.6%
jan 1, 1973
53.907
+0.327
0.61%
jan 1, 1974
54.249
+0.342
0.63%
jan 1, 1975
54.611
+0.362
0.67%
jan 1, 1976
55.006
+0.395
0.72%
jan 1, 1977
55.45
+0.444
0.81%
jan 1, 1978
55.946
+0.496
0.89%
jan 1, 1979
56.483
+0.537
0.96%
jan 1, 1980
57.047
+0.564
1.0%
jan 1, 1981
57.629
+0.582
1.02%
jan 1, 1982
58.218
+0.589
1.02%
jan 1, 1983
58.786
+0.568
0.98%
jan 1, 1984
59.295
+0.509
0.87%
jan 1, 1985
59.702
+0.407
0.69%
jan 1, 1986
59.963
+0.261
0.44%
jan 1, 1987
60.038
+0.075
0.13%
jan 1, 1988
59.906
-0.132
-0.22%
jan 1, 1989
59.548
-0.358
-0.6%
jan 1, 1990
58.948
-0.6
-1.01%
jan 1, 1991
58.066
-0.882
-1.5%
jan 1, 1992
56.864
-1.202
-2.07%
jan 1, 1993
55.371
-1.493
-2.63%
jan 1, 1994
53.647
-1.724
-3.11%
jan 1, 1995
51.767
-1.88
-3.5%
jan 1, 1996
49.819
-1.948
-3.76%
jan 1, 1997
47.893
-1.926
-3.87%
jan 1, 1998
46.082
-1.811
-3.78%
jan 1, 1999
44.476
-1.606
-3.49%
jan 1, 2000
43.151
-1.325
-2.98%
jan 1, 2001
42.167
-0.984
-2.28%
jan 1, 2002
41.549
-0.618
-1.47%
jan 1, 2003
41.265
-0.284
-0.68%
jan 1, 2004
41.282
+0.017
0.04%
jan 1, 2005
41.593
+0.311
0.75%
jan 1, 2006
42.204
+0.611
1.47%
jan 1, 2007
43.119
+0.915
2.17%
jan 1, 2008
44.308
+1.189
2.76%
jan 1, 2009
45.724
+1.416
3.2%
jan 1, 2010
47.311
+1.587
3.47%
jan 1, 2011
49.021
+1.71
3.61%
jan 1, 2012
50.815
+1.794
3.66%
jan 1, 2013
52.646
+1.831
3.6%
jan 1, 2014
54.453
+1.807
3.43%
jan 1, 2015
56.171
+1.718
3.16%
Ranking of countries by current statistics by years


Comments: