29
/
en
AIzaSyAYiBZKx7MnpbEhh9jyipgxe19OcubqV5w
April 1, 2024
86812
Bolivia
BOL
true
2
1
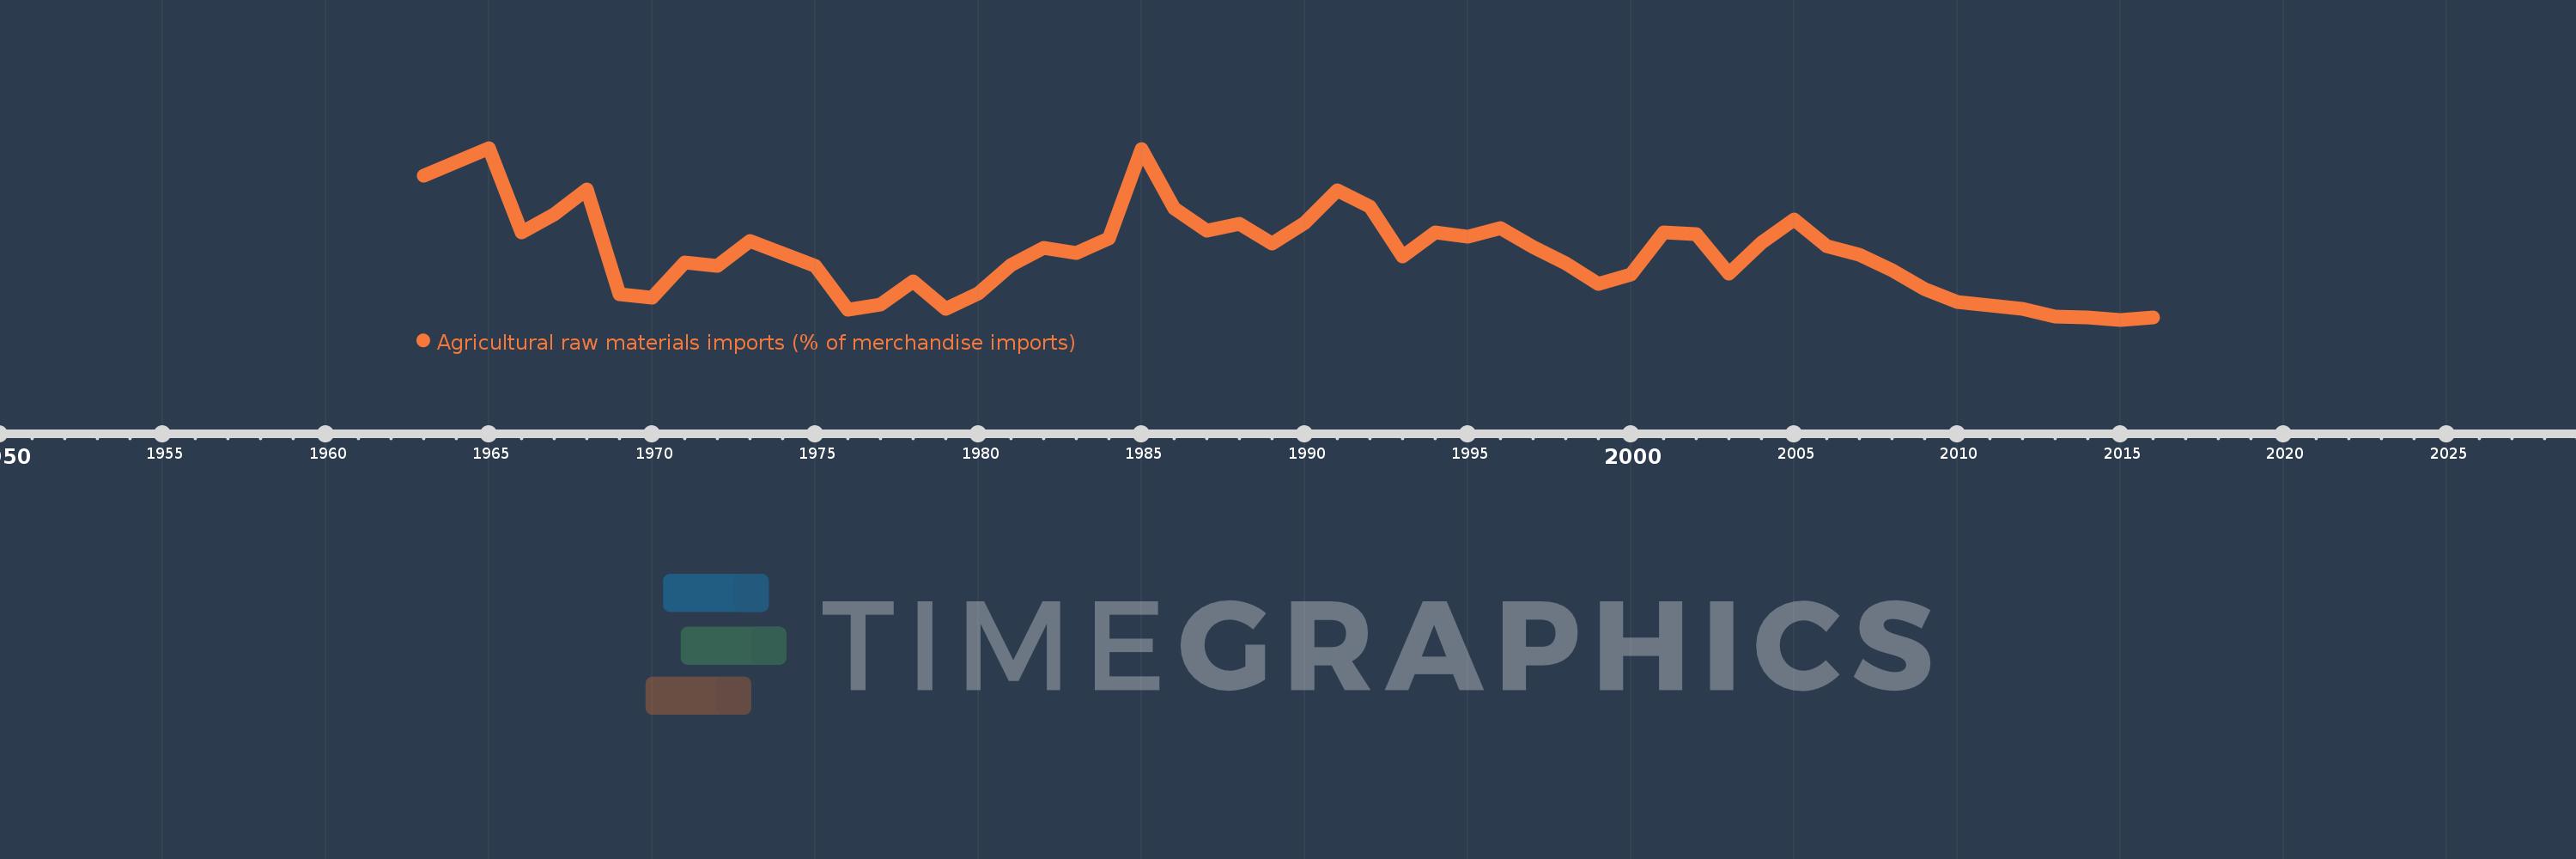
Agricultural raw materials imports (% of merchandise imports)
2016,2015,2014,2013,2012,2011,2010,2009,2008,2007,2006,2005,2004,2003,2002,2001,2000,1999,1998,1997,1996,1995,1994,1993,1992,1991,1990,1989,1988,1987,1986,1985,1984,1983,1982,1981,1980,1979,1978,1977,1976,1975,1973,1972,1971,1970,1969,1968,1967,1966,1965,1964,1963
This statistics in other country:
AfghanistanAlbaniaAlgeriaAndorraAngolaAntigua and BarbudaArab WorldArgentinaArmeniaArubaAustraliaAustriaAzerbaijanBahamas, TheBahrainBangladeshBarbadosBelarusBelgiumBelizeBeninBermudaBhutanBoliviaBosnia and HerzegovinaBotswanaBrazilBrunei DarussalamBulgariaBurkina FasoBurundiCabo VerdeCambodiaCameroonCanadaCaribbean small statesCayman IslandsCentral African RepublicCentral Europe and the BalticsChadChileChinaColombiaComorosCongo, Dem. Rep.Congo, Rep.Costa RicaCote d'IvoireCroatiaCubaCyprusCzech RepublicDenmarkDjiboutiDominicaDominican RepublicEarly-demographic dividendEast Asia & PacificEast Asia & Pacific (excluding high income)East Asia & Pacific (IDA & IBRD countries)EcuadorEgypt, Arab Rep.El SalvadorEquatorial GuineaEritreaEstoniaEthiopiaEuro areaEurope & Central AsiaEurope & Central Asia (excluding high income)Europe & Central Asia (IDA & IBRD countries)European UnionFaroe IslandsFijiFinlandFragile and conflict affected situationsFranceFrench PolynesiaGabonGambia, TheGeorgiaGermanyGhanaGreeceGreenlandGrenadaGuatemalaGuineaGuinea-BissauGuyanaHaitiHeavily indebted poor countries (HIPC)High incomeHondurasHong Kong SAR, ChinaHungaryIBRD onlyIcelandIDA & IBRD totalIDA blendIDA onlyIDA totalIndiaIndonesiaIran, Islamic Rep.IraqIrelandIsraelItalyJamaicaJapanJordanKazakhstanKenyaKiribatiKorea, Rep.KuwaitKyrgyz RepublicLao PDRLate-demographic dividendLatin America & Caribbean Latin America & Caribbean (excluding high income)Latin America & the Caribbean (IDA & IBRD countries)LatviaLeast developed countries: UN classificationLebanonLesothoLiberiaLibyaLithuaniaLow & middle incomeLow incomeLower middle incomeLuxembourgMacao SAR, ChinaMacedonia, FYRMadagascarMalawiMalaysiaMaldivesMaliMaltaMauritaniaMauritiusMexicoMiddle East & North AfricaMiddle East & North Africa (excluding high income)Middle East & North Africa (IDA & IBRD countries)Middle incomeMoldovaMongoliaMoroccoMozambiqueMyanmarNamibiaNepalNetherlandsNew CaledoniaNew ZealandNicaraguaNigerNigeriaNorth AmericaNorwayOECD membersOmanOther small statesPacific island small statesPakistanPalauPanamaPapua New GuineaParaguayPeruPhilippinesPolandPortugalPost-demographic dividendPre-demographic dividendQatarRomaniaRussian FederationRwandaSamoaSao Tome and PrincipeSaudi ArabiaSenegalSerbiaSeychellesSierra LeoneSingaporeSlovak RepublicSloveniaSmall statesSolomon IslandsSomaliaSouth AfricaSouth AsiaSouth Asia (IDA & IBRD)SpainSri LankaSt. Kitts and NevisSt. LuciaSt. Vincent and the GrenadinesSub-Saharan Africa Sub-Saharan Africa (excluding high income)Sub-Saharan Africa (IDA & IBRD countries)SudanSurinameSwazilandSwedenSwitzerlandSyrian Arab RepublicTajikistanTanzaniaThailandTimor-LesteTogoTongaTrinidad and TobagoTunisiaTurkeyTurkmenistanTurks and Caicos IslandsTuvaluUgandaUkraineUnited Arab EmiratesUnited KingdomUnited StatesUpper middle incomeUruguayVanuatuVenezuela, RBVietnamVirgin Islands (U.S.)WorldYemen, Rep.ZambiaZimbabwe Timeline:
This timeline shows a graph from 1963 to 2016 of Bolivia. No data until 1962. Number of actual observations by date: 53.
Source name:
World Development Indicators
Source organization:
World Bank staff estimates from the Comtrade database maintained by the United Nations Statistics Division.
Categories, topics:
Agriculture & Rural Development, Private Sector, Trade
Last updated:
apr 23, 2017
Indicators value changes by year
At the date of observation
Value
Absolute change
Change from previous value
jan 1, 1963
2.353
+2.353
0.0%
jan 1, 1964
2.533
+0.181
7.69%
jan 1, 1965
2.715
+0.182
7.18%
jan 1, 1966
1.619
-1.096
-40.36%
jan 1, 1967
1.861
+0.242
14.94%
jan 1, 1968
2.184
+0.322
17.32%
jan 1, 1969
0.827
-1.356
-62.11%
jan 1, 1970
0.781
-0.046
-5.58%
jan 1, 1971
1.237
+0.456
58.4%
jan 1, 1972
1.19
-0.048
-3.86%
jan 1, 1973
1.513
+0.323
27.15%
jan 1, 1975
1.189
-0.323
-21.37%
jan 1, 1976
0.624
-0.565
-47.53%
jan 1, 1977
0.696
+0.071
11.45%
jan 1, 1978
0.994
+0.299
42.94%
jan 1, 1979
0.636
-0.358
-36.03%
jan 1, 1980
0.84
+0.204
32.06%
jan 1, 1981
1.202
+0.362
43.1%
jan 1, 1982
1.419
+0.217
18.07%
jan 1, 1983
1.354
-0.065
-4.59%
jan 1, 1984
1.542
+0.188
13.86%
jan 1, 1985
2.702
+1.16
75.24%
jan 1, 1986
1.938
-0.764
-28.27%
jan 1, 1987
1.645
-0.293
-15.12%
jan 1, 1988
1.734
+0.09
5.45%
jan 1, 1989
1.483
-0.251
-14.47%
jan 1, 1990
1.749
+0.266
17.91%
jan 1, 1991
2.169
+0.42
24.0%
jan 1, 1992
1.956
-0.213
-9.83%
jan 1, 1993
1.309
-0.647
-33.07%
jan 1, 1994
1.619
+0.31
23.67%
jan 1, 1995
1.573
-0.046
-2.84%
jan 1, 1996
1.681
+0.108
6.86%
jan 1, 1997
1.433
-0.248
-14.75%
jan 1, 1998
1.221
-0.211
-14.76%
jan 1, 1999
0.958
-0.264
-21.6%
jan 1, 2000
1.083
+0.125
13.09%
jan 1, 2001
1.619
+0.536
49.47%
jan 1, 2002
1.598
-0.021
-1.27%
jan 1, 2003
1.086
-0.512
-32.04%
jan 1, 2004
1.49
+0.404
37.18%
jan 1, 2005
1.786
+0.296
19.88%
jan 1, 2006
1.444
-0.342
-19.14%
jan 1, 2007
1.335
-0.109
-7.58%
jan 1, 2008
1.13
-0.205
-15.34%
jan 1, 2009
0.886
-0.244
-21.59%
jan 1, 2010
0.724
-0.162
-18.25%
jan 1, 2011
0.685
-0.039
-5.38%
jan 1, 2012
0.637
-0.048
-7.02%
jan 1, 2013
0.532
-0.105
-16.44%
jan 1, 2014
0.523
-0.009
-1.72%
jan 1, 2015
0.494
-0.03
-5.67%
jan 1, 2016
0.523
+0.029
5.96%
Ranking of countries by current statistics by years


Comments: