29
/
en
AIzaSyAYiBZKx7MnpbEhh9jyipgxe19OcubqV5w
April 1, 2024
29653
Euro area
EMU
false
2
1
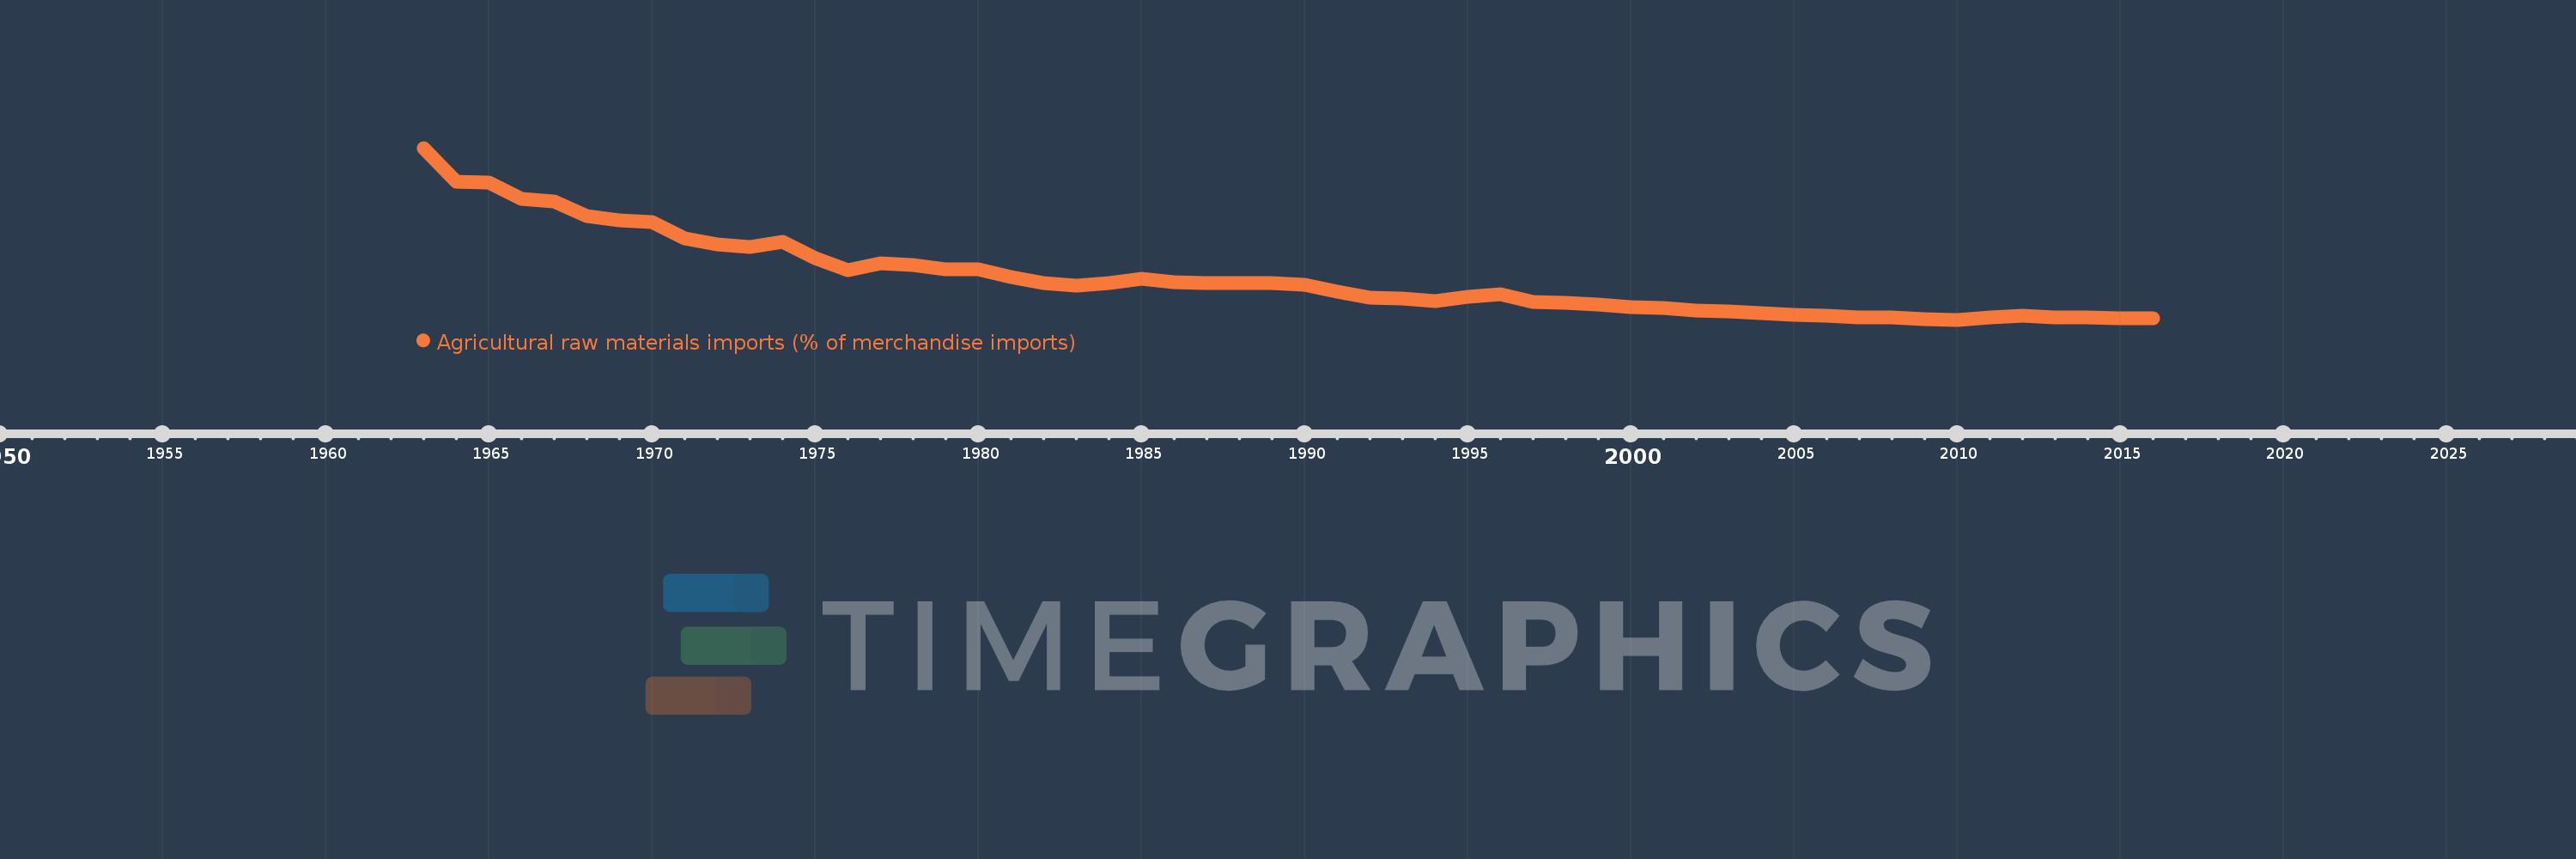
Agricultural raw materials imports (% of merchandise imports)
2016,2015,2014,2013,2012,2011,2010,2009,2008,2007,2006,2005,2004,2003,2002,2001,2000,1999,1998,1997,1996,1995,1994,1993,1992,1991,1990,1989,1988,1987,1986,1985,1984,1983,1982,1981,1980,1979,1978,1977,1976,1975,1974,1973,1972,1971,1970,1969,1968,1967,1966,1965,1964,1963
This statistics in other country:
AfghanistanAlbaniaAlgeriaAndorraAngolaAntigua and BarbudaArab WorldArgentinaArmeniaArubaAustraliaAustriaAzerbaijanBahamas, TheBahrainBangladeshBarbadosBelarusBelgiumBelizeBeninBermudaBhutanBoliviaBosnia and HerzegovinaBotswanaBrazilBrunei DarussalamBulgariaBurkina FasoBurundiCabo VerdeCambodiaCameroonCanadaCaribbean small statesCayman IslandsCentral African RepublicCentral Europe and the BalticsChadChileChinaColombiaComorosCongo, Dem. Rep.Congo, Rep.Costa RicaCote d'IvoireCroatiaCubaCyprusCzech RepublicDenmarkDjiboutiDominicaDominican RepublicEarly-demographic dividendEast Asia & PacificEast Asia & Pacific (excluding high income)East Asia & Pacific (IDA & IBRD countries)EcuadorEgypt, Arab Rep.El SalvadorEquatorial GuineaEritreaEstoniaEthiopiaEuro areaEurope & Central AsiaEurope & Central Asia (excluding high income)Europe & Central Asia (IDA & IBRD countries)European UnionFaroe IslandsFijiFinlandFragile and conflict affected situationsFranceFrench PolynesiaGabonGambia, TheGeorgiaGermanyGhanaGreeceGreenlandGrenadaGuatemalaGuineaGuinea-BissauGuyanaHaitiHeavily indebted poor countries (HIPC)High incomeHondurasHong Kong SAR, ChinaHungaryIBRD onlyIcelandIDA & IBRD totalIDA blendIDA onlyIDA totalIndiaIndonesiaIran, Islamic Rep.IraqIrelandIsraelItalyJamaicaJapanJordanKazakhstanKenyaKiribatiKorea, Rep.KuwaitKyrgyz RepublicLao PDRLate-demographic dividendLatin America & Caribbean Latin America & Caribbean (excluding high income)Latin America & the Caribbean (IDA & IBRD countries)LatviaLeast developed countries: UN classificationLebanonLesothoLiberiaLibyaLithuaniaLow & middle incomeLow incomeLower middle incomeLuxembourgMacao SAR, ChinaMacedonia, FYRMadagascarMalawiMalaysiaMaldivesMaliMaltaMauritaniaMauritiusMexicoMiddle East & North AfricaMiddle East & North Africa (excluding high income)Middle East & North Africa (IDA & IBRD countries)Middle incomeMoldovaMongoliaMoroccoMozambiqueMyanmarNamibiaNepalNetherlandsNew CaledoniaNew ZealandNicaraguaNigerNigeriaNorth AmericaNorwayOECD membersOmanOther small statesPacific island small statesPakistanPalauPanamaPapua New GuineaParaguayPeruPhilippinesPolandPortugalPost-demographic dividendPre-demographic dividendQatarRomaniaRussian FederationRwandaSamoaSao Tome and PrincipeSaudi ArabiaSenegalSerbiaSeychellesSierra LeoneSingaporeSlovak RepublicSloveniaSmall statesSolomon IslandsSomaliaSouth AfricaSouth AsiaSouth Asia (IDA & IBRD)SpainSri LankaSt. Kitts and NevisSt. LuciaSt. Vincent and the GrenadinesSub-Saharan Africa Sub-Saharan Africa (excluding high income)Sub-Saharan Africa (IDA & IBRD countries)SudanSurinameSwazilandSwedenSwitzerlandSyrian Arab RepublicTajikistanTanzaniaThailandTimor-LesteTogoTongaTrinidad and TobagoTunisiaTurkeyTurkmenistanTurks and Caicos IslandsTuvaluUgandaUkraineUnited Arab EmiratesUnited KingdomUnited StatesUpper middle incomeUruguayVanuatuVenezuela, RBVietnamVirgin Islands (U.S.)WorldYemen, Rep.ZambiaZimbabwe Timeline:
This timeline shows a graph from 1963 to 2016 of Euro area. No data until 1962. Number of actual observations by date: 54.
Source name:
World Development Indicators
Source organization:
World Bank staff estimates from the Comtrade database maintained by the United Nations Statistics Division.
Categories, topics:
Agriculture & Rural Development, Private Sector, Trade
Last updated:
apr 23, 2017
Indicators value changes by year
At the date of observation
Value
Absolute change
Change from previous value
jan 1, 1963
12.39
+12.39
0.0%
jan 1, 1964
10.243
-2.147
-17.33%
jan 1, 1965
10.191
-0.052
-0.51%
jan 1, 1966
9.136
-1.056
-10.36%
jan 1, 1967
8.946
-0.189
-2.07%
jan 1, 1968
8.028
-0.918
-10.26%
jan 1, 1969
7.783
-0.245
-3.05%
jan 1, 1970
7.629
-0.155
-1.99%
jan 1, 1971
6.607
-1.022
-13.39%
jan 1, 1972
6.246
-0.361
-5.47%
jan 1, 1973
6.058
-0.187
-3.0%
jan 1, 1974
6.381
+0.323
5.33%
jan 1, 1975
5.345
-1.035
-16.23%
jan 1, 1976
4.562
-0.783
-14.66%
jan 1, 1977
5.016
+0.454
9.95%
jan 1, 1978
4.892
-0.124
-2.48%
jan 1, 1979
4.615
-0.277
-5.66%
jan 1, 1980
4.613
-0.002
-0.04%
jan 1, 1981
4.14
-0.473
-10.25%
jan 1, 1982
3.775
-0.364
-8.8%
jan 1, 1983
3.615
-0.161
-4.26%
jan 1, 1984
3.726
+0.111
3.07%
jan 1, 1985
4.015
+0.289
7.77%
jan 1, 1986
3.807
-0.208
-5.18%
jan 1, 1987
3.73
-0.077
-2.02%
jan 1, 1988
3.731
+0.0
0.01%
jan 1, 1989
3.751
+0.021
0.55%
jan 1, 1990
3.618
-0.133
-3.56%
jan 1, 1991
3.179
-0.439
-12.14%
jan 1, 1992
2.794
-0.385
-12.11%
jan 1, 1993
2.774
-0.02
-0.7%
jan 1, 1994
2.611
-0.163
-5.86%
jan 1, 1995
2.9
+0.289
11.06%
jan 1, 1996
3.025
+0.125
4.31%
jan 1, 1997
2.545
-0.48
-15.87%
jan 1, 1998
2.51
-0.035
-1.39%
jan 1, 1999
2.376
-0.134
-5.34%
jan 1, 2000
2.198
-0.178
-7.49%
jan 1, 2001
2.154
-0.043
-1.98%
jan 1, 2002
1.994
-0.161
-7.46%
jan 1, 2003
1.956
-0.038
-1.9%
jan 1, 2004
1.848
-0.108
-5.51%
jan 1, 2005
1.709
-0.139
-7.51%
jan 1, 2006
1.645
-0.064
-3.76%
jan 1, 2007
1.578
-0.067
-4.06%
jan 1, 2008
1.579
+0.001
0.03%
jan 1, 2009
1.431
-0.148
-9.37%
jan 1, 2010
1.409
-0.022
-1.54%
jan 1, 2011
1.564
+0.155
11.03%
jan 1, 2012
1.656
+0.091
5.84%
jan 1, 2013
1.532
-0.124
-7.48%
jan 1, 2014
1.549
+0.017
1.1%
jan 1, 2015
1.514
-0.034
-2.21%
jan 1, 2016
1.489
-0.025
-1.67%
Ranking of countries by current statistics by years


Comments: