29
/
en
AIzaSyAYiBZKx7MnpbEhh9jyipgxe19OcubqV5w
April 1, 2024
35528
High income
HIC
false
2
1
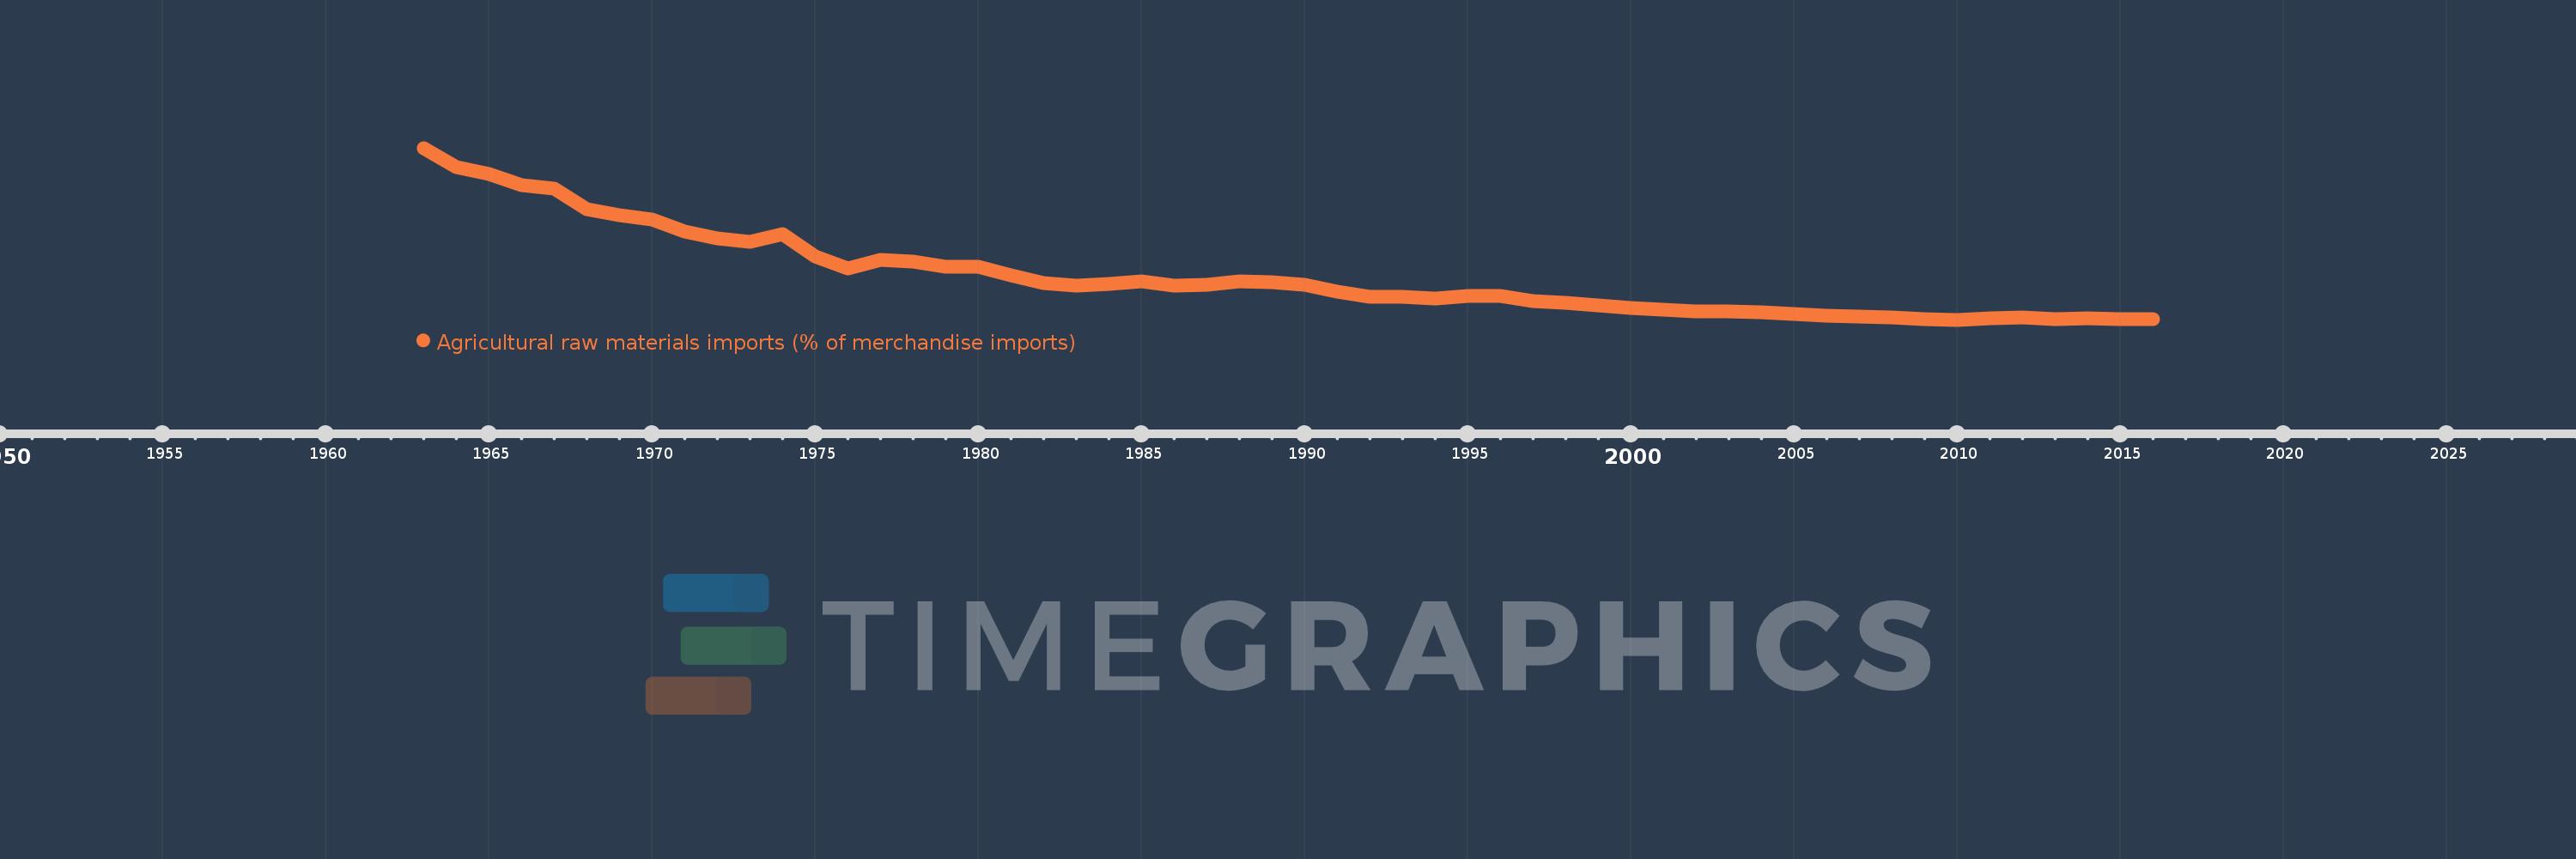
Agricultural raw materials imports (% of merchandise imports)
2016,2015,2014,2013,2012,2011,2010,2009,2008,2007,2006,2005,2004,2003,2002,2001,2000,1999,1998,1997,1996,1995,1994,1993,1992,1991,1990,1989,1988,1987,1986,1985,1984,1983,1982,1981,1980,1979,1978,1977,1976,1975,1974,1973,1972,1971,1970,1969,1968,1967,1966,1965,1964,1963
This statistics in other country:
AfghanistanAlbaniaAlgeriaAndorraAngolaAntigua and BarbudaArab WorldArgentinaArmeniaArubaAustraliaAustriaAzerbaijanBahamas, TheBahrainBangladeshBarbadosBelarusBelgiumBelizeBeninBermudaBhutanBoliviaBosnia and HerzegovinaBotswanaBrazilBrunei DarussalamBulgariaBurkina FasoBurundiCabo VerdeCambodiaCameroonCanadaCaribbean small statesCayman IslandsCentral African RepublicCentral Europe and the BalticsChadChileChinaColombiaComorosCongo, Dem. Rep.Congo, Rep.Costa RicaCote d'IvoireCroatiaCubaCyprusCzech RepublicDenmarkDjiboutiDominicaDominican RepublicEarly-demographic dividendEast Asia & PacificEast Asia & Pacific (excluding high income)East Asia & Pacific (IDA & IBRD countries)EcuadorEgypt, Arab Rep.El SalvadorEquatorial GuineaEritreaEstoniaEthiopiaEuro areaEurope & Central AsiaEurope & Central Asia (excluding high income)Europe & Central Asia (IDA & IBRD countries)European UnionFaroe IslandsFijiFinlandFragile and conflict affected situationsFranceFrench PolynesiaGabonGambia, TheGeorgiaGermanyGhanaGreeceGreenlandGrenadaGuatemalaGuineaGuinea-BissauGuyanaHaitiHeavily indebted poor countries (HIPC)High incomeHondurasHong Kong SAR, ChinaHungaryIBRD onlyIcelandIDA & IBRD totalIDA blendIDA onlyIDA totalIndiaIndonesiaIran, Islamic Rep.IraqIrelandIsraelItalyJamaicaJapanJordanKazakhstanKenyaKiribatiKorea, Rep.KuwaitKyrgyz RepublicLao PDRLate-demographic dividendLatin America & Caribbean Latin America & Caribbean (excluding high income)Latin America & the Caribbean (IDA & IBRD countries)LatviaLeast developed countries: UN classificationLebanonLesothoLiberiaLibyaLithuaniaLow & middle incomeLow incomeLower middle incomeLuxembourgMacao SAR, ChinaMacedonia, FYRMadagascarMalawiMalaysiaMaldivesMaliMaltaMauritaniaMauritiusMexicoMiddle East & North AfricaMiddle East & North Africa (excluding high income)Middle East & North Africa (IDA & IBRD countries)Middle incomeMoldovaMongoliaMoroccoMozambiqueMyanmarNamibiaNepalNetherlandsNew CaledoniaNew ZealandNicaraguaNigerNigeriaNorth AmericaNorwayOECD membersOmanOther small statesPacific island small statesPakistanPalauPanamaPapua New GuineaParaguayPeruPhilippinesPolandPortugalPost-demographic dividendPre-demographic dividendQatarRomaniaRussian FederationRwandaSamoaSao Tome and PrincipeSaudi ArabiaSenegalSerbiaSeychellesSierra LeoneSingaporeSlovak RepublicSloveniaSmall statesSolomon IslandsSomaliaSouth AfricaSouth AsiaSouth Asia (IDA & IBRD)SpainSri LankaSt. Kitts and NevisSt. LuciaSt. Vincent and the GrenadinesSub-Saharan Africa Sub-Saharan Africa (excluding high income)Sub-Saharan Africa (IDA & IBRD countries)SudanSurinameSwazilandSwedenSwitzerlandSyrian Arab RepublicTajikistanTanzaniaThailandTimor-LesteTogoTongaTrinidad and TobagoTunisiaTurkeyTurkmenistanTurks and Caicos IslandsTuvaluUgandaUkraineUnited Arab EmiratesUnited KingdomUnited StatesUpper middle incomeUruguayVanuatuVenezuela, RBVietnamVirgin Islands (U.S.)WorldYemen, Rep.ZambiaZimbabwe Timeline:
This timeline shows a graph from 1963 to 2016 of High income. No data until 1962. Number of actual observations by date: 54.
Source name:
World Development Indicators
Source organization:
World Bank staff estimates from the Comtrade database maintained by the United Nations Statistics Division.
Categories, topics:
Agriculture & Rural Development, Private Sector, Trade
Last updated:
apr 23, 2017
Indicators value changes by year
Maximum:
13.138
jan 1, 1963
At the date of observation
Value
Absolute change
Change from previous value
jan 1, 1963
13.138
+13.138
0.0%
jan 1, 1964
11.82
-1.317
-10.03%
jan 1, 1965
11.309
-0.511
-4.33%
jan 1, 1966
10.518
-0.791
-7.0%
jan 1, 1967
10.327
-0.191
-1.82%
jan 1, 1968
8.838
-1.489
-14.42%
jan 1, 1969
8.415
-0.422
-4.78%
jan 1, 1970
8.129
-0.287
-3.41%
jan 1, 1971
7.288
-0.841
-10.35%
jan 1, 1972
6.813
-0.475
-6.52%
jan 1, 1973
6.576
-0.236
-3.47%
jan 1, 1974
7.143
+0.567
8.62%
jan 1, 1975
5.569
-1.574
-22.03%
jan 1, 1976
4.748
-0.821
-14.74%
jan 1, 1977
5.354
+0.606
12.76%
jan 1, 1978
5.222
-0.132
-2.46%
jan 1, 1979
4.874
-0.348
-6.67%
jan 1, 1980
4.833
-0.041
-0.84%
jan 1, 1981
4.221
-0.612
-12.66%
jan 1, 1982
3.705
-0.516
-12.22%
jan 1, 1983
3.52
-0.185
-5.0%
jan 1, 1984
3.671
+0.151
4.3%
jan 1, 1985
3.827
+0.155
4.23%
jan 1, 1986
3.534
-0.293
-7.66%
jan 1, 1987
3.588
+0.054
1.53%
jan 1, 1988
3.809
+0.221
6.17%
jan 1, 1989
3.773
-0.036
-0.94%
jan 1, 1990
3.585
-0.188
-4.99%
jan 1, 1991
3.119
-0.466
-13.01%
jan 1, 1992
2.763
-0.356
-11.41%
jan 1, 1993
2.725
-0.038
-1.38%
jan 1, 1994
2.655
-0.07
-2.57%
jan 1, 1995
2.797
+0.142
5.36%
jan 1, 1996
2.825
+0.028
1.0%
jan 1, 1997
2.452
-0.372
-13.18%
jan 1, 1998
2.357
-0.095
-3.89%
jan 1, 1999
2.142
-0.215
-9.12%
jan 1, 2000
1.977
-0.165
-7.71%
jan 1, 2001
1.865
-0.112
-5.68%
jan 1, 2002
1.758
-0.107
-5.75%
jan 1, 2003
1.736
-0.022
-1.24%
jan 1, 2004
1.647
-0.089
-5.13%
jan 1, 2005
1.568
-0.079
-4.8%
jan 1, 2006
1.451
-0.117
-7.47%
jan 1, 2007
1.38
-0.07
-4.86%
jan 1, 2008
1.322
-0.058
-4.2%
jan 1, 2009
1.186
-0.136
-10.25%
jan 1, 2010
1.149
-0.038
-3.17%
jan 1, 2011
1.275
+0.126
10.99%
jan 1, 2012
1.327
+0.052
4.06%
jan 1, 2013
1.201
-0.126
-9.49%
jan 1, 2014
1.227
+0.026
2.16%
jan 1, 2015
1.206
-0.021
-1.69%
jan 1, 2016
1.204
-0.002
-0.2%
Ranking of countries by current statistics by years


Comments: