29
/
en
AIzaSyAYiBZKx7MnpbEhh9jyipgxe19OcubqV5w
April 1, 2024
154217
India
IND
true
2
1
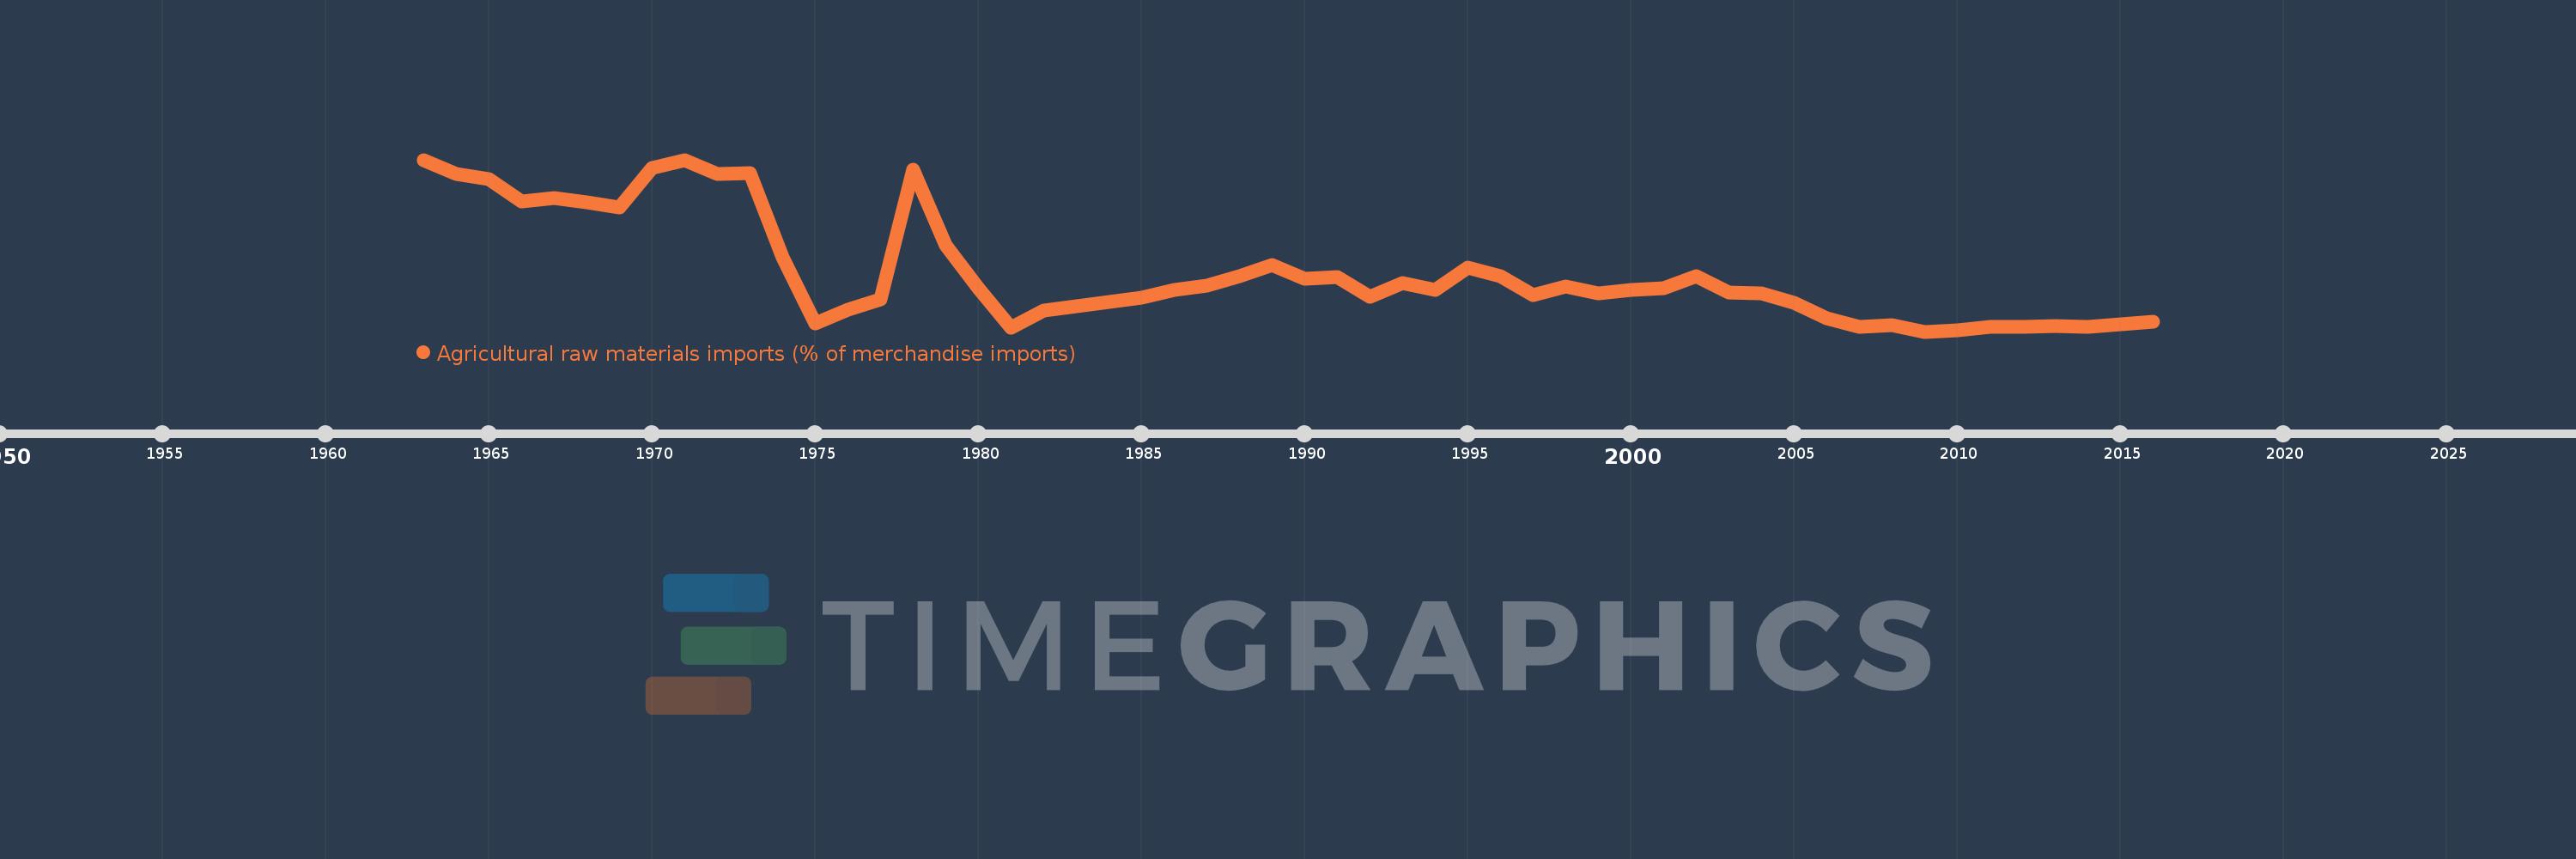
Agricultural raw materials imports (% of merchandise imports)
2016,2015,2014,2013,2012,2011,2010,2009,2008,2007,2006,2005,2004,2003,2002,2001,2000,1999,1998,1997,1996,1995,1994,1993,1992,1991,1990,1989,1988,1987,1986,1985,1984,1982,1981,1980,1979,1978,1977,1976,1975,1974,1973,1972,1971,1970,1969,1968,1967,1966,1965,1964,1963
This statistics in other country:
AfghanistanAlbaniaAlgeriaAndorraAngolaAntigua and BarbudaArab WorldArgentinaArmeniaArubaAustraliaAustriaAzerbaijanBahamas, TheBahrainBangladeshBarbadosBelarusBelgiumBelizeBeninBermudaBhutanBoliviaBosnia and HerzegovinaBotswanaBrazilBrunei DarussalamBulgariaBurkina FasoBurundiCabo VerdeCambodiaCameroonCanadaCaribbean small statesCayman IslandsCentral African RepublicCentral Europe and the BalticsChadChileChinaColombiaComorosCongo, Dem. Rep.Congo, Rep.Costa RicaCote d'IvoireCroatiaCubaCyprusCzech RepublicDenmarkDjiboutiDominicaDominican RepublicEarly-demographic dividendEast Asia & PacificEast Asia & Pacific (excluding high income)East Asia & Pacific (IDA & IBRD countries)EcuadorEgypt, Arab Rep.El SalvadorEquatorial GuineaEritreaEstoniaEthiopiaEuro areaEurope & Central AsiaEurope & Central Asia (excluding high income)Europe & Central Asia (IDA & IBRD countries)European UnionFaroe IslandsFijiFinlandFragile and conflict affected situationsFranceFrench PolynesiaGabonGambia, TheGeorgiaGermanyGhanaGreeceGreenlandGrenadaGuatemalaGuineaGuinea-BissauGuyanaHaitiHeavily indebted poor countries (HIPC)High incomeHondurasHong Kong SAR, ChinaHungaryIBRD onlyIcelandIDA & IBRD totalIDA blendIDA onlyIDA totalIndiaIndonesiaIran, Islamic Rep.IraqIrelandIsraelItalyJamaicaJapanJordanKazakhstanKenyaKiribatiKorea, Rep.KuwaitKyrgyz RepublicLao PDRLate-demographic dividendLatin America & Caribbean Latin America & Caribbean (excluding high income)Latin America & the Caribbean (IDA & IBRD countries)LatviaLeast developed countries: UN classificationLebanonLesothoLiberiaLibyaLithuaniaLow & middle incomeLow incomeLower middle incomeLuxembourgMacao SAR, ChinaMacedonia, FYRMadagascarMalawiMalaysiaMaldivesMaliMaltaMauritaniaMauritiusMexicoMiddle East & North AfricaMiddle East & North Africa (excluding high income)Middle East & North Africa (IDA & IBRD countries)Middle incomeMoldovaMongoliaMoroccoMozambiqueMyanmarNamibiaNepalNetherlandsNew CaledoniaNew ZealandNicaraguaNigerNigeriaNorth AmericaNorwayOECD membersOmanOther small statesPacific island small statesPakistanPalauPanamaPapua New GuineaParaguayPeruPhilippinesPolandPortugalPost-demographic dividendPre-demographic dividendQatarRomaniaRussian FederationRwandaSamoaSao Tome and PrincipeSaudi ArabiaSenegalSerbiaSeychellesSierra LeoneSingaporeSlovak RepublicSloveniaSmall statesSolomon IslandsSomaliaSouth AfricaSouth AsiaSouth Asia (IDA & IBRD)SpainSri LankaSt. Kitts and NevisSt. LuciaSt. Vincent and the GrenadinesSub-Saharan Africa Sub-Saharan Africa (excluding high income)Sub-Saharan Africa (IDA & IBRD countries)SudanSurinameSwazilandSwedenSwitzerlandSyrian Arab RepublicTajikistanTanzaniaThailandTimor-LesteTogoTongaTrinidad and TobagoTunisiaTurkeyTurkmenistanTurks and Caicos IslandsTuvaluUgandaUkraineUnited Arab EmiratesUnited KingdomUnited StatesUpper middle incomeUruguayVanuatuVenezuela, RBVietnamVirgin Islands (U.S.)WorldYemen, Rep.ZambiaZimbabwe Timeline:
This timeline shows a graph from 1963 to 2016 of India. No data until 1962. Number of actual observations by date: 53.
Source name:
World Development Indicators
Source organization:
World Bank staff estimates from the Comtrade database maintained by the United Nations Statistics Division.
Categories, topics:
Agriculture & Rural Development, Private Sector, Trade
Last updated:
apr 23, 2017
Indicators value changes by year
At the date of observation
Value
Absolute change
Change from previous value
jan 1, 1963
9.242
+9.242
0.0%
jan 1, 1964
8.603
-0.639
-6.91%
jan 1, 1965
8.384
-0.22
-2.55%
jan 1, 1966
7.394
-0.99
-11.81%
jan 1, 1967
7.546
+0.152
2.06%
jan 1, 1968
7.324
-0.222
-2.94%
jan 1, 1969
7.117
-0.207
-2.83%
jan 1, 1970
8.875
+1.758
24.7%
jan 1, 1971
9.207
+0.332
3.74%
jan 1, 1972
8.625
-0.582
-6.32%
jan 1, 1973
8.665
+0.04
0.46%
jan 1, 1974
4.891
-3.774
-43.56%
jan 1, 1975
1.942
-2.948
-60.29%
jan 1, 1976
2.543
+0.6
30.91%
jan 1, 1977
3.003
+0.461
18.11%
jan 1, 1978
8.798
+5.795
192.95%
jan 1, 1979
5.441
-3.357
-38.16%
jan 1, 1980
3.493
-1.948
-35.8%
jan 1, 1981
1.741
-1.752
-50.15%
jan 1, 1982
2.522
+0.78
44.81%
jan 1, 1984
2.904
+0.382
15.16%
jan 1, 1985
3.076
+0.172
5.94%
jan 1, 1986
3.423
+0.346
11.26%
jan 1, 1987
3.618
+0.196
5.71%
jan 1, 1988
4.023
+0.405
11.2%
jan 1, 1989
4.526
+0.503
12.49%
jan 1, 1990
3.917
-0.609
-13.45%
jan 1, 1991
3.991
+0.073
1.87%
jan 1, 1992
3.12
-0.871
-21.83%
jan 1, 1993
3.724
+0.605
19.39%
jan 1, 1994
3.416
-0.309
-8.28%
jan 1, 1995
4.413
+0.998
29.21%
jan 1, 1996
4.022
-0.391
-8.86%
jan 1, 1997
3.184
-0.838
-20.83%
jan 1, 1998
3.592
+0.408
12.8%
jan 1, 1999
3.288
-0.303
-8.45%
jan 1, 2000
3.443
+0.154
4.69%
jan 1, 2001
3.492
+0.049
1.43%
jan 1, 2002
4.026
+0.534
15.3%
jan 1, 2003
3.318
-0.708
-17.59%
jan 1, 2004
3.291
-0.027
-0.8%
jan 1, 2005
2.837
-0.454
-13.81%
jan 1, 2006
2.15
-0.687
-24.22%
jan 1, 2007
1.794
-0.356
-16.57%
jan 1, 2008
1.871
+0.077
4.29%
jan 1, 2009
1.565
-0.306
-16.33%
jan 1, 2010
1.635
+0.07
4.49%
jan 1, 2011
1.776
+0.141
8.61%
jan 1, 2012
1.772
-0.004
-0.24%
jan 1, 2013
1.827
+0.056
3.14%
jan 1, 2014
1.789
-0.039
-2.11%
jan 1, 2015
1.897
+0.108
6.02%
jan 1, 2016
2.006
+0.109
5.75%
Ranking of countries by current statistics by years


Comments: