29
/
en
AIzaSyAYiBZKx7MnpbEhh9jyipgxe19OcubqV5w
April 1, 2024
221797
Peru
PER
true
2
1
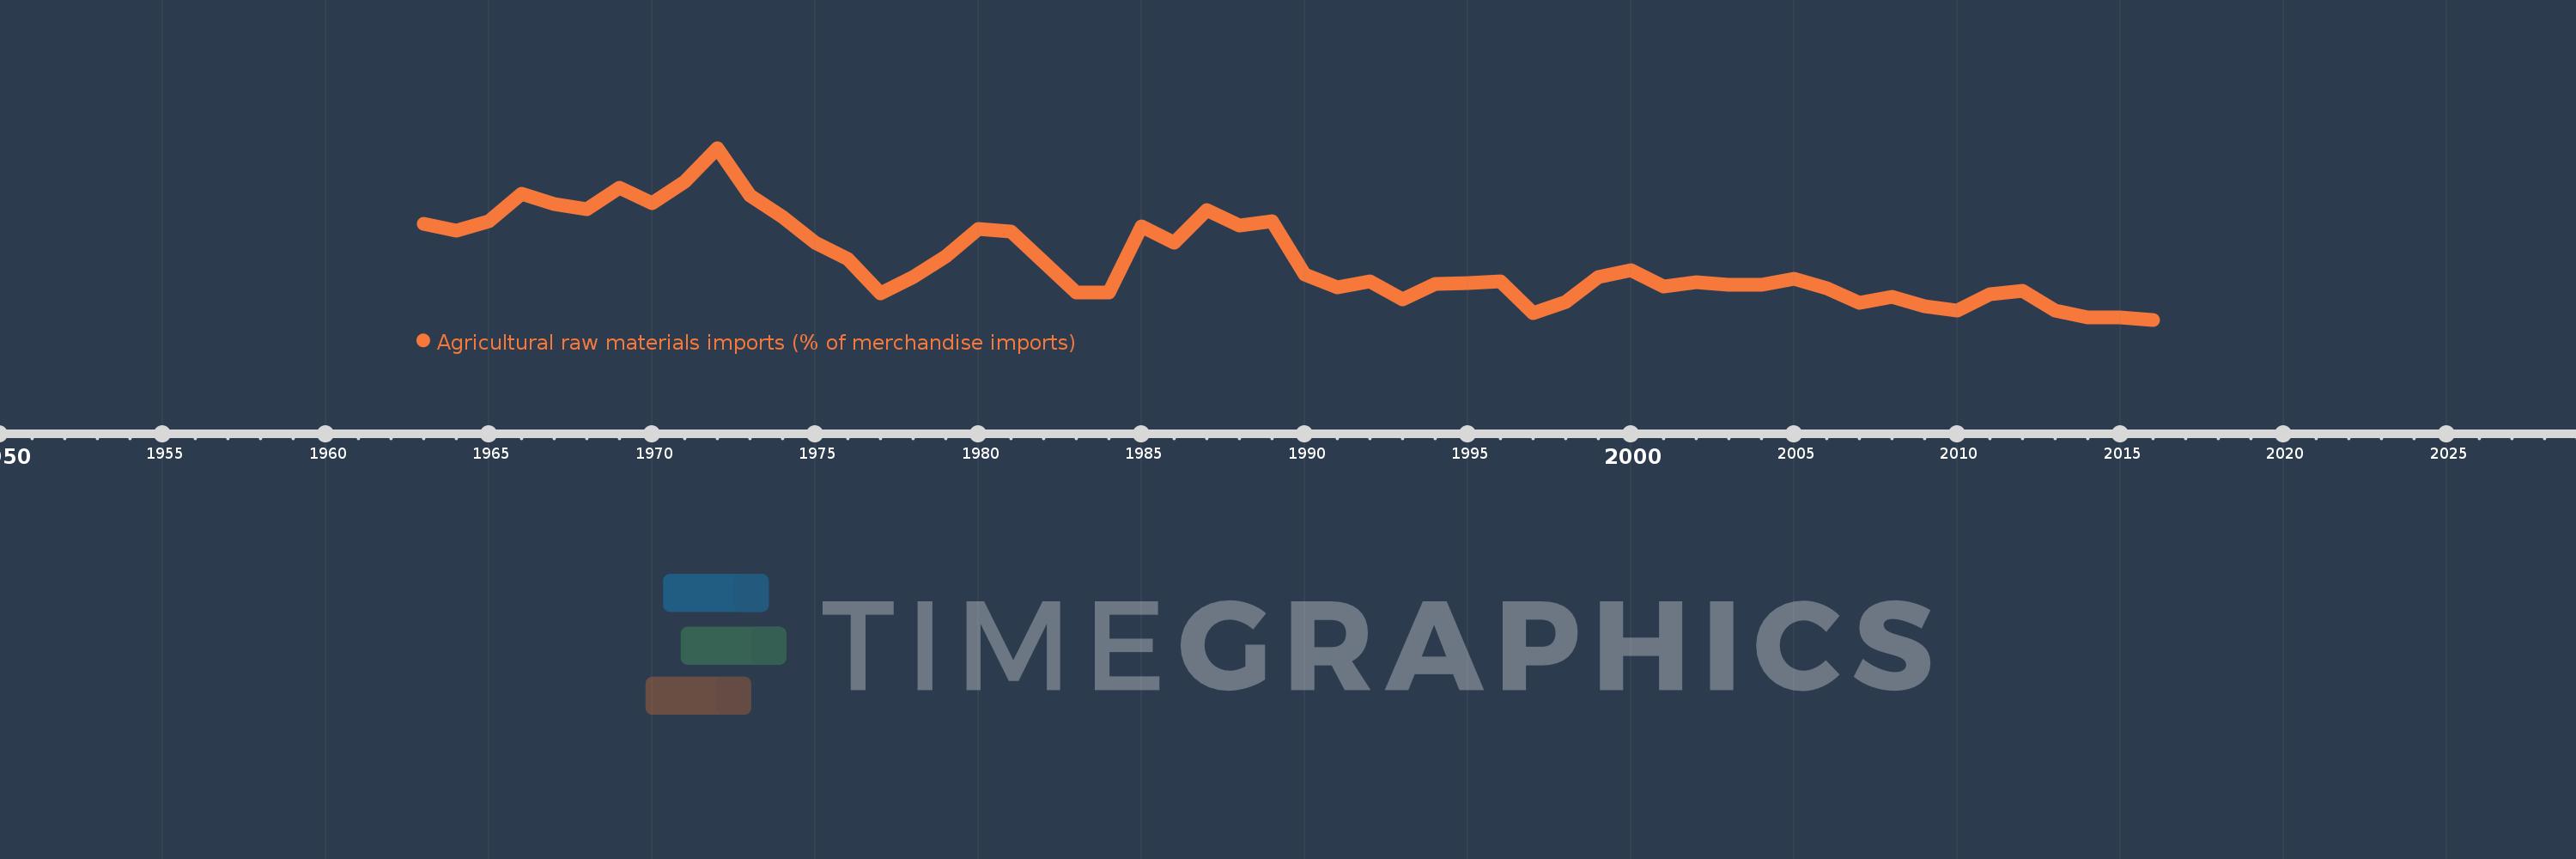
Agricultural raw materials imports (% of merchandise imports)
2016,2015,2014,2013,2012,2011,2010,2009,2008,2007,2006,2005,2004,2003,2002,2001,2000,1999,1998,1997,1996,1995,1994,1993,1992,1991,1990,1989,1988,1987,1986,1985,1984,1983,1981,1980,1979,1978,1977,1976,1975,1974,1973,1972,1971,1970,1969,1968,1967,1966,1965,1964,1963
This statistics in other country:
AfghanistanAlbaniaAlgeriaAndorraAngolaAntigua and BarbudaArab WorldArgentinaArmeniaArubaAustraliaAustriaAzerbaijanBahamas, TheBahrainBangladeshBarbadosBelarusBelgiumBelizeBeninBermudaBhutanBoliviaBosnia and HerzegovinaBotswanaBrazilBrunei DarussalamBulgariaBurkina FasoBurundiCabo VerdeCambodiaCameroonCanadaCaribbean small statesCayman IslandsCentral African RepublicCentral Europe and the BalticsChadChileChinaColombiaComorosCongo, Dem. Rep.Congo, Rep.Costa RicaCote d'IvoireCroatiaCubaCyprusCzech RepublicDenmarkDjiboutiDominicaDominican RepublicEarly-demographic dividendEast Asia & PacificEast Asia & Pacific (excluding high income)East Asia & Pacific (IDA & IBRD countries)EcuadorEgypt, Arab Rep.El SalvadorEquatorial GuineaEritreaEstoniaEthiopiaEuro areaEurope & Central AsiaEurope & Central Asia (excluding high income)Europe & Central Asia (IDA & IBRD countries)European UnionFaroe IslandsFijiFinlandFragile and conflict affected situationsFranceFrench PolynesiaGabonGambia, TheGeorgiaGermanyGhanaGreeceGreenlandGrenadaGuatemalaGuineaGuinea-BissauGuyanaHaitiHeavily indebted poor countries (HIPC)High incomeHondurasHong Kong SAR, ChinaHungaryIBRD onlyIcelandIDA & IBRD totalIDA blendIDA onlyIDA totalIndiaIndonesiaIran, Islamic Rep.IraqIrelandIsraelItalyJamaicaJapanJordanKazakhstanKenyaKiribatiKorea, Rep.KuwaitKyrgyz RepublicLao PDRLate-demographic dividendLatin America & Caribbean Latin America & Caribbean (excluding high income)Latin America & the Caribbean (IDA & IBRD countries)LatviaLeast developed countries: UN classificationLebanonLesothoLiberiaLibyaLithuaniaLow & middle incomeLow incomeLower middle incomeLuxembourgMacao SAR, ChinaMacedonia, FYRMadagascarMalawiMalaysiaMaldivesMaliMaltaMauritaniaMauritiusMexicoMiddle East & North AfricaMiddle East & North Africa (excluding high income)Middle East & North Africa (IDA & IBRD countries)Middle incomeMoldovaMongoliaMoroccoMozambiqueMyanmarNamibiaNepalNetherlandsNew CaledoniaNew ZealandNicaraguaNigerNigeriaNorth AmericaNorwayOECD membersOmanOther small statesPacific island small statesPakistanPalauPanamaPapua New GuineaParaguayPeruPhilippinesPolandPortugalPost-demographic dividendPre-demographic dividendQatarRomaniaRussian FederationRwandaSamoaSao Tome and PrincipeSaudi ArabiaSenegalSerbiaSeychellesSierra LeoneSingaporeSlovak RepublicSloveniaSmall statesSolomon IslandsSomaliaSouth AfricaSouth AsiaSouth Asia (IDA & IBRD)SpainSri LankaSt. Kitts and NevisSt. LuciaSt. Vincent and the GrenadinesSub-Saharan Africa Sub-Saharan Africa (excluding high income)Sub-Saharan Africa (IDA & IBRD countries)SudanSurinameSwazilandSwedenSwitzerlandSyrian Arab RepublicTajikistanTanzaniaThailandTimor-LesteTogoTongaTrinidad and TobagoTunisiaTurkeyTurkmenistanTurks and Caicos IslandsTuvaluUgandaUkraineUnited Arab EmiratesUnited KingdomUnited StatesUpper middle incomeUruguayVanuatuVenezuela, RBVietnamVirgin Islands (U.S.)WorldYemen, Rep.ZambiaZimbabwe Timeline:
This timeline shows a graph from 1963 to 2016 of Peru. No data until 1962. Number of actual observations by date: 53.
Source name:
World Development Indicators
Source organization:
World Bank staff estimates from the Comtrade database maintained by the United Nations Statistics Division.
Categories, topics:
Agriculture & Rural Development, Private Sector, Trade
Last updated:
apr 23, 2017
Indicators value changes by year
At the date of observation
Value
Absolute change
Change from previous value
jan 1, 1963
2.978
+2.978
0.0%
jan 1, 1964
2.857
-0.12
-4.05%
jan 1, 1965
3.029
+0.172
6.01%
jan 1, 1966
3.54
+0.511
16.86%
jan 1, 1967
3.344
-0.196
-5.54%
jan 1, 1968
3.257
-0.087
-2.61%
jan 1, 1969
3.653
+0.397
12.18%
jan 1, 1970
3.356
-0.297
-8.14%
jan 1, 1971
3.764
+0.408
12.17%
jan 1, 1972
4.395
+0.631
16.75%
jan 1, 1973
3.515
-0.88
-20.03%
jan 1, 1974
3.099
-0.415
-11.82%
jan 1, 1975
2.629
-0.471
-15.19%
jan 1, 1976
2.316
-0.313
-11.91%
jan 1, 1977
1.672
-0.644
-27.81%
jan 1, 1978
1.982
+0.31
18.54%
jan 1, 1979
2.371
+0.39
19.66%
jan 1, 1980
2.877
+0.506
21.35%
jan 1, 1981
2.827
-0.051
-1.77%
jan 1, 1983
1.698
-1.129
-39.92%
jan 1, 1984
1.696
-0.002
-0.11%
jan 1, 1985
2.93
+1.234
72.75%
jan 1, 1986
2.629
-0.302
-10.3%
jan 1, 1987
3.229
+0.6
22.83%
jan 1, 1988
2.95
-0.278
-8.62%
jan 1, 1989
3.031
+0.081
2.73%
jan 1, 1990
2.034
-0.997
-32.9%
jan 1, 1991
1.788
-0.246
-12.1%
jan 1, 1992
1.904
+0.117
6.53%
jan 1, 1993
1.57
-0.334
-17.55%
jan 1, 1994
1.852
+0.282
17.94%
jan 1, 1995
1.873
+0.021
1.14%
jan 1, 1996
1.896
+0.023
1.23%
jan 1, 1997
1.304
-0.592
-31.23%
jan 1, 1998
1.511
+0.207
15.9%
jan 1, 1999
1.985
+0.474
31.33%
jan 1, 2000
2.11
+0.125
6.3%
jan 1, 2001
1.806
-0.304
-14.39%
jan 1, 2002
1.88
+0.074
4.1%
jan 1, 2003
1.842
-0.038
-2.03%
jan 1, 2004
1.842
+0.0
0.01%
jan 1, 2005
1.955
+0.113
6.11%
jan 1, 2006
1.778
-0.176
-9.03%
jan 1, 2007
1.505
-0.274
-15.4%
jan 1, 2008
1.61
+0.106
7.03%
jan 1, 2009
1.43
-0.181
-11.22%
jan 1, 2010
1.351
-0.079
-5.5%
jan 1, 2011
1.654
+0.303
22.44%
jan 1, 2012
1.719
+0.065
3.93%
jan 1, 2013
1.357
-0.362
-21.04%
jan 1, 2014
1.236
-0.121
-8.93%
jan 1, 2015
1.225
-0.012
-0.94%
jan 1, 2016
1.185
-0.04
-3.23%
Ranking of countries by current statistics by years


Comments: