29
/
en
AIzaSyAYiBZKx7MnpbEhh9jyipgxe19OcubqV5w
April 1, 2024
42089
Latin America & Caribbean (excluding high income)
LAC
false
2
1
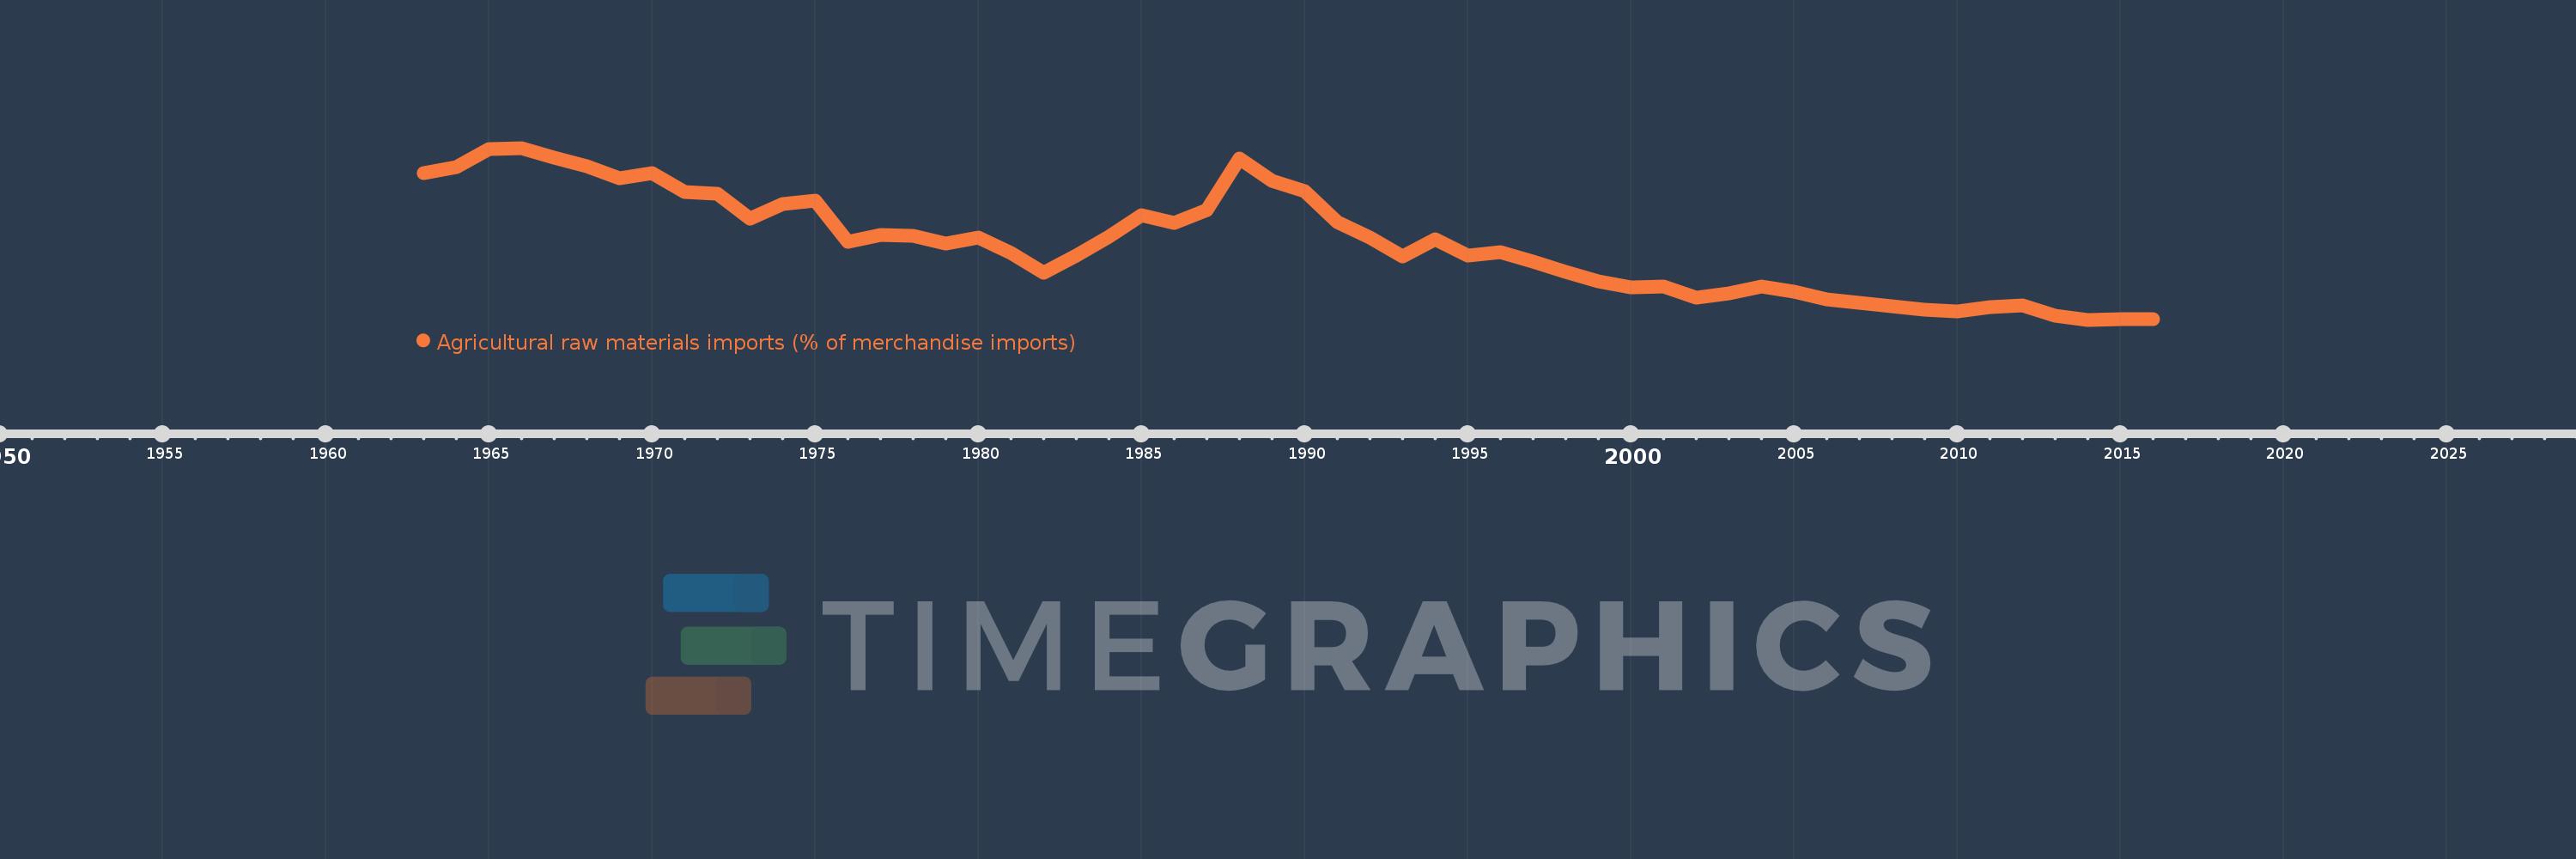
Agricultural raw materials imports (% of merchandise imports)
2016,2015,2014,2013,2012,2011,2010,2009,2008,2007,2006,2005,2004,2003,2002,2001,2000,1999,1998,1997,1996,1995,1994,1993,1992,1991,1990,1989,1988,1987,1986,1985,1984,1983,1982,1981,1980,1979,1978,1977,1976,1975,1974,1973,1972,1971,1970,1969,1968,1967,1966,1965,1964,1963
This statistics in other country:
AfghanistanAlbaniaAlgeriaAndorraAngolaAntigua and BarbudaArab WorldArgentinaArmeniaArubaAustraliaAustriaAzerbaijanBahamas, TheBahrainBangladeshBarbadosBelarusBelgiumBelizeBeninBermudaBhutanBoliviaBosnia and HerzegovinaBotswanaBrazilBrunei DarussalamBulgariaBurkina FasoBurundiCabo VerdeCambodiaCameroonCanadaCaribbean small statesCayman IslandsCentral African RepublicCentral Europe and the BalticsChadChileChinaColombiaComorosCongo, Dem. Rep.Congo, Rep.Costa RicaCote d'IvoireCroatiaCubaCyprusCzech RepublicDenmarkDjiboutiDominicaDominican RepublicEarly-demographic dividendEast Asia & PacificEast Asia & Pacific (excluding high income)East Asia & Pacific (IDA & IBRD countries)EcuadorEgypt, Arab Rep.El SalvadorEquatorial GuineaEritreaEstoniaEthiopiaEuro areaEurope & Central AsiaEurope & Central Asia (excluding high income)Europe & Central Asia (IDA & IBRD countries)European UnionFaroe IslandsFijiFinlandFragile and conflict affected situationsFranceFrench PolynesiaGabonGambia, TheGeorgiaGermanyGhanaGreeceGreenlandGrenadaGuatemalaGuineaGuinea-BissauGuyanaHaitiHeavily indebted poor countries (HIPC)High incomeHondurasHong Kong SAR, ChinaHungaryIBRD onlyIcelandIDA & IBRD totalIDA blendIDA onlyIDA totalIndiaIndonesiaIran, Islamic Rep.IraqIrelandIsraelItalyJamaicaJapanJordanKazakhstanKenyaKiribatiKorea, Rep.KuwaitKyrgyz RepublicLao PDRLate-demographic dividendLatin America & Caribbean Latin America & Caribbean (excluding high income)Latin America & the Caribbean (IDA & IBRD countries)LatviaLeast developed countries: UN classificationLebanonLesothoLiberiaLibyaLithuaniaLow & middle incomeLow incomeLower middle incomeLuxembourgMacao SAR, ChinaMacedonia, FYRMadagascarMalawiMalaysiaMaldivesMaliMaltaMauritaniaMauritiusMexicoMiddle East & North AfricaMiddle East & North Africa (excluding high income)Middle East & North Africa (IDA & IBRD countries)Middle incomeMoldovaMongoliaMoroccoMozambiqueMyanmarNamibiaNepalNetherlandsNew CaledoniaNew ZealandNicaraguaNigerNigeriaNorth AmericaNorwayOECD membersOmanOther small statesPacific island small statesPakistanPalauPanamaPapua New GuineaParaguayPeruPhilippinesPolandPortugalPost-demographic dividendPre-demographic dividendQatarRomaniaRussian FederationRwandaSamoaSao Tome and PrincipeSaudi ArabiaSenegalSerbiaSeychellesSierra LeoneSingaporeSlovak RepublicSloveniaSmall statesSolomon IslandsSomaliaSouth AfricaSouth AsiaSouth Asia (IDA & IBRD)SpainSri LankaSt. Kitts and NevisSt. LuciaSt. Vincent and the GrenadinesSub-Saharan Africa Sub-Saharan Africa (excluding high income)Sub-Saharan Africa (IDA & IBRD countries)SudanSurinameSwazilandSwedenSwitzerlandSyrian Arab RepublicTajikistanTanzaniaThailandTimor-LesteTogoTongaTrinidad and TobagoTunisiaTurkeyTurkmenistanTurks and Caicos IslandsTuvaluUgandaUkraineUnited Arab EmiratesUnited KingdomUnited StatesUpper middle incomeUruguayVanuatuVenezuela, RBVietnamVirgin Islands (U.S.)WorldYemen, Rep.ZambiaZimbabwe Timeline:
This timeline shows a graph from 1963 to 2016 of Latin America & Caribbean (excluding high income). No data until 1962. Number of actual observations by date: 54.
Source name:
World Development Indicators
Source organization:
World Bank staff estimates from the Comtrade database maintained by the United Nations Statistics Division.
Categories, topics:
Agriculture & Rural Development, Private Sector, Trade
Last updated:
apr 23, 2017
Indicators value changes by year
At the date of observation
Value
Absolute change
Change from previous value
jan 1, 1963
4.012
+4.012
0.0%
jan 1, 1964
4.125
+0.113
2.81%
jan 1, 1965
4.504
+0.379
9.18%
jan 1, 1966
4.523
+0.019
0.42%
jan 1, 1967
4.322
-0.201
-4.44%
jan 1, 1968
4.152
-0.17
-3.94%
jan 1, 1969
3.904
-0.248
-5.97%
jan 1, 1970
4.004
+0.1
2.56%
jan 1, 1971
3.608
-0.396
-9.88%
jan 1, 1972
3.587
-0.021
-0.59%
jan 1, 1973
3.065
-0.522
-14.55%
jan 1, 1974
3.368
+0.302
9.87%
jan 1, 1975
3.435
+0.067
2.0%
jan 1, 1976
2.594
-0.841
-24.49%
jan 1, 1977
2.729
+0.135
5.21%
jan 1, 1978
2.718
-0.011
-0.4%
jan 1, 1979
2.565
-0.153
-5.64%
jan 1, 1980
2.673
+0.108
4.2%
jan 1, 1981
2.367
-0.305
-11.43%
jan 1, 1982
1.95
-0.417
-17.61%
jan 1, 1983
2.302
+0.352
18.05%
jan 1, 1984
2.701
+0.399
17.32%
jan 1, 1985
3.139
+0.438
16.22%
jan 1, 1986
2.984
-0.155
-4.93%
jan 1, 1987
3.248
+0.264
8.84%
jan 1, 1988
4.305
+1.057
32.54%
jan 1, 1989
3.852
-0.453
-10.52%
jan 1, 1990
3.639
-0.214
-5.54%
jan 1, 1991
2.998
-0.641
-17.61%
jan 1, 1992
2.686
-0.312
-10.41%
jan 1, 1993
2.299
-0.387
-14.4%
jan 1, 1994
2.649
+0.349
15.2%
jan 1, 1995
2.315
-0.333
-12.59%
jan 1, 1996
2.386
+0.071
3.06%
jan 1, 1997
2.187
-0.199
-8.34%
jan 1, 1998
1.971
-0.216
-9.86%
jan 1, 1999
1.785
-0.186
-9.43%
jan 1, 2000
1.664
-0.122
-6.82%
jan 1, 2001
1.67
+0.006
0.36%
jan 1, 2002
1.441
-0.229
-13.72%
jan 1, 2003
1.527
+0.086
5.97%
jan 1, 2004
1.682
+0.155
10.16%
jan 1, 2005
1.575
-0.107
-6.35%
jan 1, 2006
1.411
-0.164
-10.4%
jan 1, 2007
1.344
-0.067
-4.78%
jan 1, 2008
1.259
-0.084
-6.28%
jan 1, 2009
1.201
-0.058
-4.59%
jan 1, 2010
1.153
-0.048
-4.0%
jan 1, 2011
1.249
+0.095
8.26%
jan 1, 2012
1.288
+0.039
3.13%
jan 1, 2013
1.068
-0.22
-17.07%
jan 1, 2014
0.99
-0.078
-7.31%
jan 1, 2015
1.002
+0.013
1.27%
jan 1, 2016
1.01
+0.008
0.75%
Ranking of countries by current statistics by years


Comments: