29
/
en
AIzaSyAYiBZKx7MnpbEhh9jyipgxe19OcubqV5w
April 1, 2024
151335
Hong Kong SAR, China
HKG
true
2
1
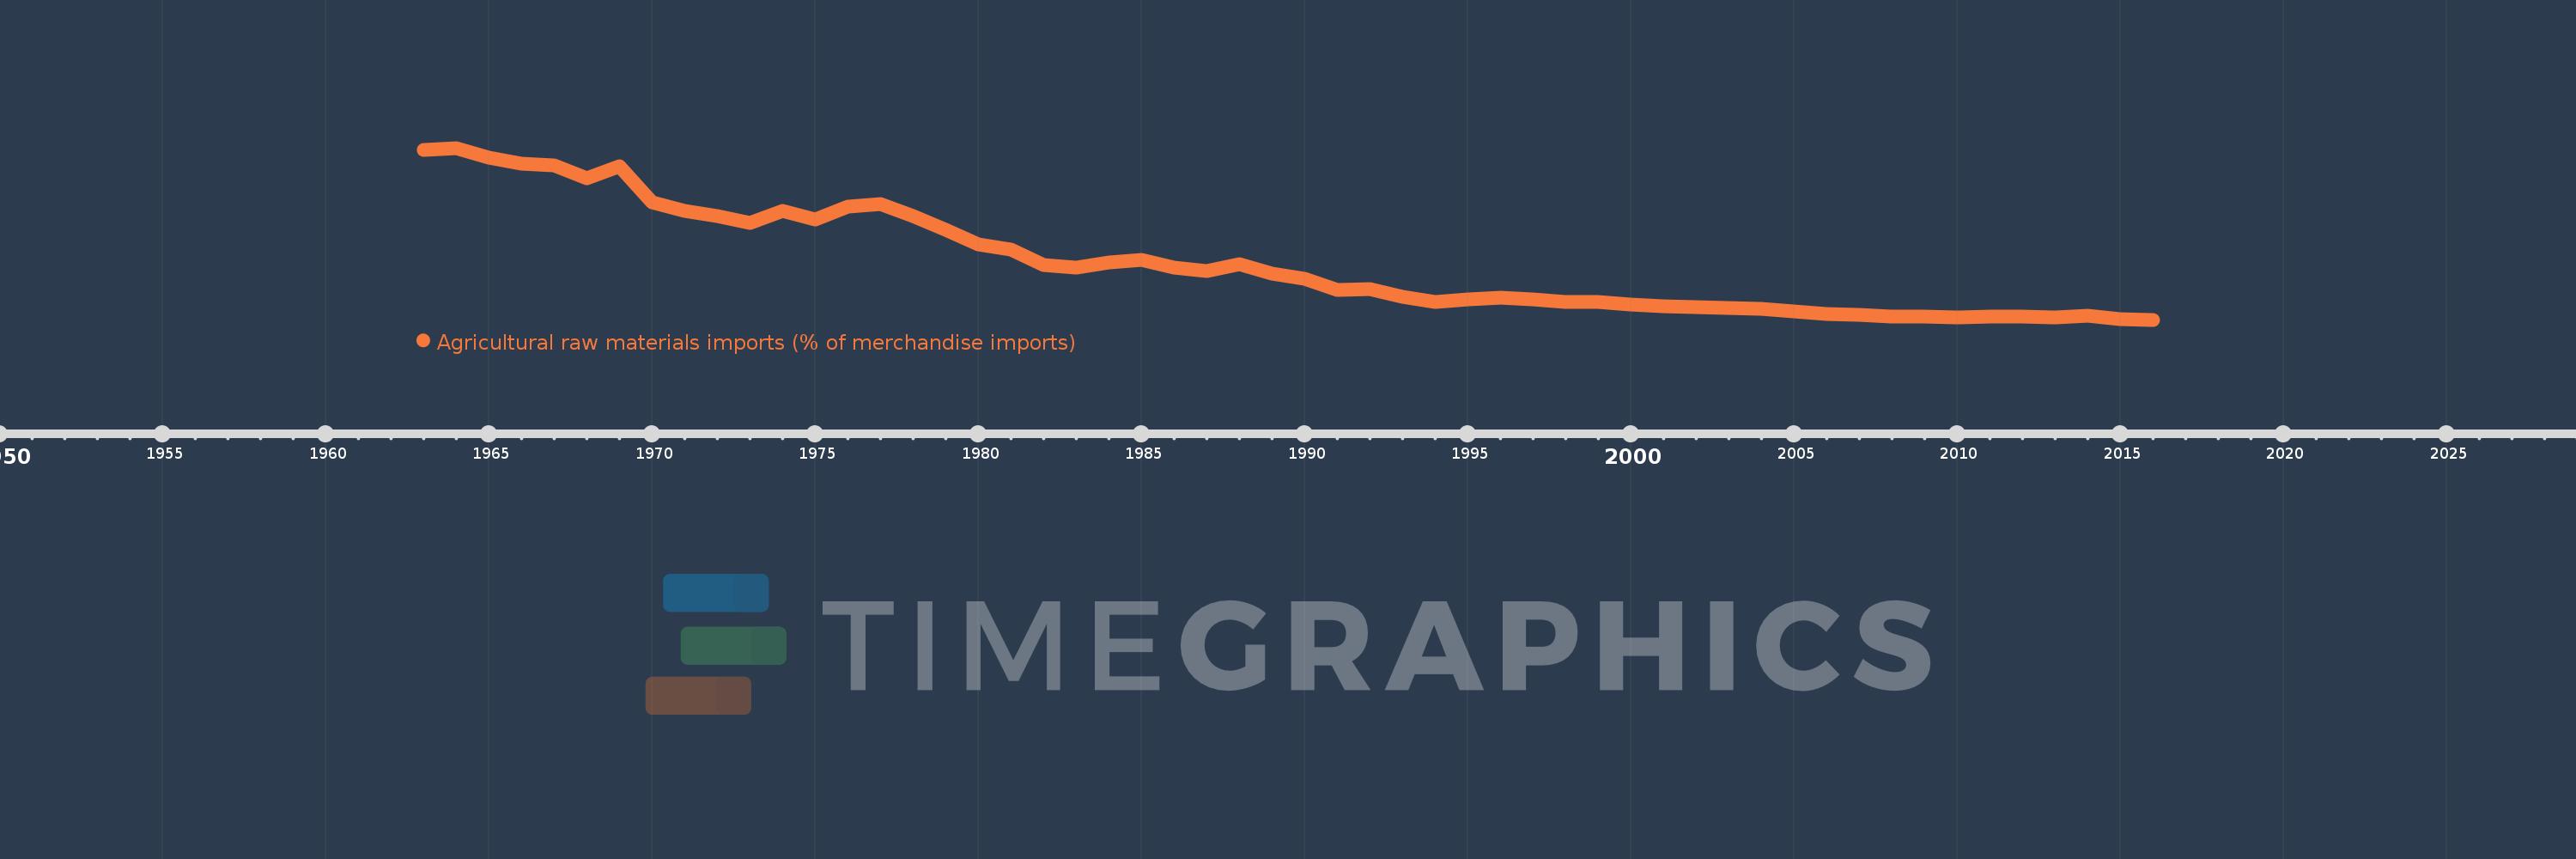
Agricultural raw materials imports (% of merchandise imports)
2016,2015,2014,2013,2012,2011,2010,2009,2008,2007,2006,2005,2004,2003,2002,2001,2000,1999,1998,1997,1996,1995,1994,1993,1992,1991,1990,1989,1988,1987,1986,1985,1984,1983,1982,1981,1980,1979,1978,1977,1976,1975,1974,1973,1972,1971,1970,1969,1968,1967,1966,1965,1964,1963
This statistics in other country:
AfghanistanAlbaniaAlgeriaAndorraAngolaAntigua and BarbudaArab WorldArgentinaArmeniaArubaAustraliaAustriaAzerbaijanBahamas, TheBahrainBangladeshBarbadosBelarusBelgiumBelizeBeninBermudaBhutanBoliviaBosnia and HerzegovinaBotswanaBrazilBrunei DarussalamBulgariaBurkina FasoBurundiCabo VerdeCambodiaCameroonCanadaCaribbean small statesCayman IslandsCentral African RepublicCentral Europe and the BalticsChadChileChinaColombiaComorosCongo, Dem. Rep.Congo, Rep.Costa RicaCote d'IvoireCroatiaCubaCyprusCzech RepublicDenmarkDjiboutiDominicaDominican RepublicEarly-demographic dividendEast Asia & PacificEast Asia & Pacific (excluding high income)East Asia & Pacific (IDA & IBRD countries)EcuadorEgypt, Arab Rep.El SalvadorEquatorial GuineaEritreaEstoniaEthiopiaEuro areaEurope & Central AsiaEurope & Central Asia (excluding high income)Europe & Central Asia (IDA & IBRD countries)European UnionFaroe IslandsFijiFinlandFragile and conflict affected situationsFranceFrench PolynesiaGabonGambia, TheGeorgiaGermanyGhanaGreeceGreenlandGrenadaGuatemalaGuineaGuinea-BissauGuyanaHaitiHeavily indebted poor countries (HIPC)High incomeHondurasHong Kong SAR, ChinaHungaryIBRD onlyIcelandIDA & IBRD totalIDA blendIDA onlyIDA totalIndiaIndonesiaIran, Islamic Rep.IraqIrelandIsraelItalyJamaicaJapanJordanKazakhstanKenyaKiribatiKorea, Rep.KuwaitKyrgyz RepublicLao PDRLate-demographic dividendLatin America & Caribbean Latin America & Caribbean (excluding high income)Latin America & the Caribbean (IDA & IBRD countries)LatviaLeast developed countries: UN classificationLebanonLesothoLiberiaLibyaLithuaniaLow & middle incomeLow incomeLower middle incomeLuxembourgMacao SAR, ChinaMacedonia, FYRMadagascarMalawiMalaysiaMaldivesMaliMaltaMauritaniaMauritiusMexicoMiddle East & North AfricaMiddle East & North Africa (excluding high income)Middle East & North Africa (IDA & IBRD countries)Middle incomeMoldovaMongoliaMoroccoMozambiqueMyanmarNamibiaNepalNetherlandsNew CaledoniaNew ZealandNicaraguaNigerNigeriaNorth AmericaNorwayOECD membersOmanOther small statesPacific island small statesPakistanPalauPanamaPapua New GuineaParaguayPeruPhilippinesPolandPortugalPost-demographic dividendPre-demographic dividendQatarRomaniaRussian FederationRwandaSamoaSao Tome and PrincipeSaudi ArabiaSenegalSerbiaSeychellesSierra LeoneSingaporeSlovak RepublicSloveniaSmall statesSolomon IslandsSomaliaSouth AfricaSouth AsiaSouth Asia (IDA & IBRD)SpainSri LankaSt. Kitts and NevisSt. LuciaSt. Vincent and the GrenadinesSub-Saharan Africa Sub-Saharan Africa (excluding high income)Sub-Saharan Africa (IDA & IBRD countries)SudanSurinameSwazilandSwedenSwitzerlandSyrian Arab RepublicTajikistanTanzaniaThailandTimor-LesteTogoTongaTrinidad and TobagoTunisiaTurkeyTurkmenistanTurks and Caicos IslandsTuvaluUgandaUkraineUnited Arab EmiratesUnited KingdomUnited StatesUpper middle incomeUruguayVanuatuVenezuela, RBVietnamVirgin Islands (U.S.)WorldYemen, Rep.ZambiaZimbabwe Timeline:
This timeline shows a graph from 1963 to 2016 of Hong Kong SAR, China. No data until 1962. Number of actual observations by date: 54.
Source name:
World Development Indicators
Source organization:
World Bank staff estimates from the Comtrade database maintained by the United Nations Statistics Division.
Categories, topics:
Agriculture & Rural Development, Private Sector, Trade
Last updated:
apr 23, 2017
Indicators value changes by year
Maximum:
10.353
jan 1, 1964
At the date of observation
Value
Absolute change
Change from previous value
jan 1, 1963
10.256
+10.256
0.0%
jan 1, 1964
10.353
+0.098
0.95%
jan 1, 1965
9.813
-0.54
-5.22%
jan 1, 1966
9.427
-0.386
-3.93%
jan 1, 1967
9.37
-0.058
-0.61%
jan 1, 1968
8.62
-0.749
-8.0%
jan 1, 1969
9.29
+0.67
7.77%
jan 1, 1970
7.187
-2.103
-22.64%
jan 1, 1971
6.735
-0.453
-6.3%
jan 1, 1972
6.43
-0.305
-4.53%
jan 1, 1973
5.996
-0.434
-6.75%
jan 1, 1974
6.702
+0.706
11.77%
jan 1, 1975
6.24
-0.461
-6.88%
jan 1, 1976
6.951
+0.711
11.39%
jan 1, 1977
7.108
+0.158
2.27%
jan 1, 1978
6.395
-0.714
-10.04%
jan 1, 1979
5.61
-0.785
-12.27%
jan 1, 1980
4.764
-0.846
-15.09%
jan 1, 1981
4.484
-0.28
-5.87%
jan 1, 1982
3.575
-0.909
-20.28%
jan 1, 1983
3.439
-0.136
-3.8%
jan 1, 1984
3.758
+0.319
9.28%
jan 1, 1985
3.886
+0.128
3.4%
jan 1, 1986
3.431
-0.455
-11.71%
jan 1, 1987
3.22
-0.211
-6.15%
jan 1, 1988
3.614
+0.394
12.24%
jan 1, 1989
3.104
-0.511
-14.13%
jan 1, 1990
2.786
-0.317
-10.23%
jan 1, 1991
2.15
-0.636
-22.82%
jan 1, 1992
2.178
+0.028
1.28%
jan 1, 1993
1.766
-0.412
-18.92%
jan 1, 1994
1.455
-0.311
-17.59%
jan 1, 1995
1.624
+0.169
11.6%
jan 1, 1996
1.677
+0.053
3.27%
jan 1, 1997
1.613
-0.064
-3.82%
jan 1, 1998
1.475
-0.138
-8.57%
jan 1, 1999
1.432
-0.043
-2.91%
jan 1, 2000
1.327
-0.105
-7.34%
jan 1, 2001
1.204
-0.123
-9.24%
jan 1, 2002
1.148
-0.056
-4.64%
jan 1, 2003
1.097
-0.052
-4.51%
jan 1, 2004
1.037
-0.06
-5.47%
jan 1, 2005
0.901
-0.136
-13.11%
jan 1, 2006
0.756
-0.145
-16.06%
jan 1, 2007
0.728
-0.028
-3.69%
jan 1, 2008
0.608
-0.121
-16.57%
jan 1, 2009
0.612
+0.004
0.71%
jan 1, 2010
0.549
-0.063
-10.26%
jan 1, 2011
0.602
+0.053
9.66%
jan 1, 2012
0.605
+0.003
0.53%
jan 1, 2013
0.578
-0.028
-4.56%
jan 1, 2014
0.659
+0.082
14.12%
jan 1, 2015
0.436
-0.223
-33.84%
jan 1, 2016
0.424
-0.012
-2.73%
Ranking of countries by current statistics by years


Comments: