29
/
en
AIzaSyAYiBZKx7MnpbEhh9jyipgxe19OcubqV5w
April 1, 2024
184810
Madagascar
MDG
true
2
1
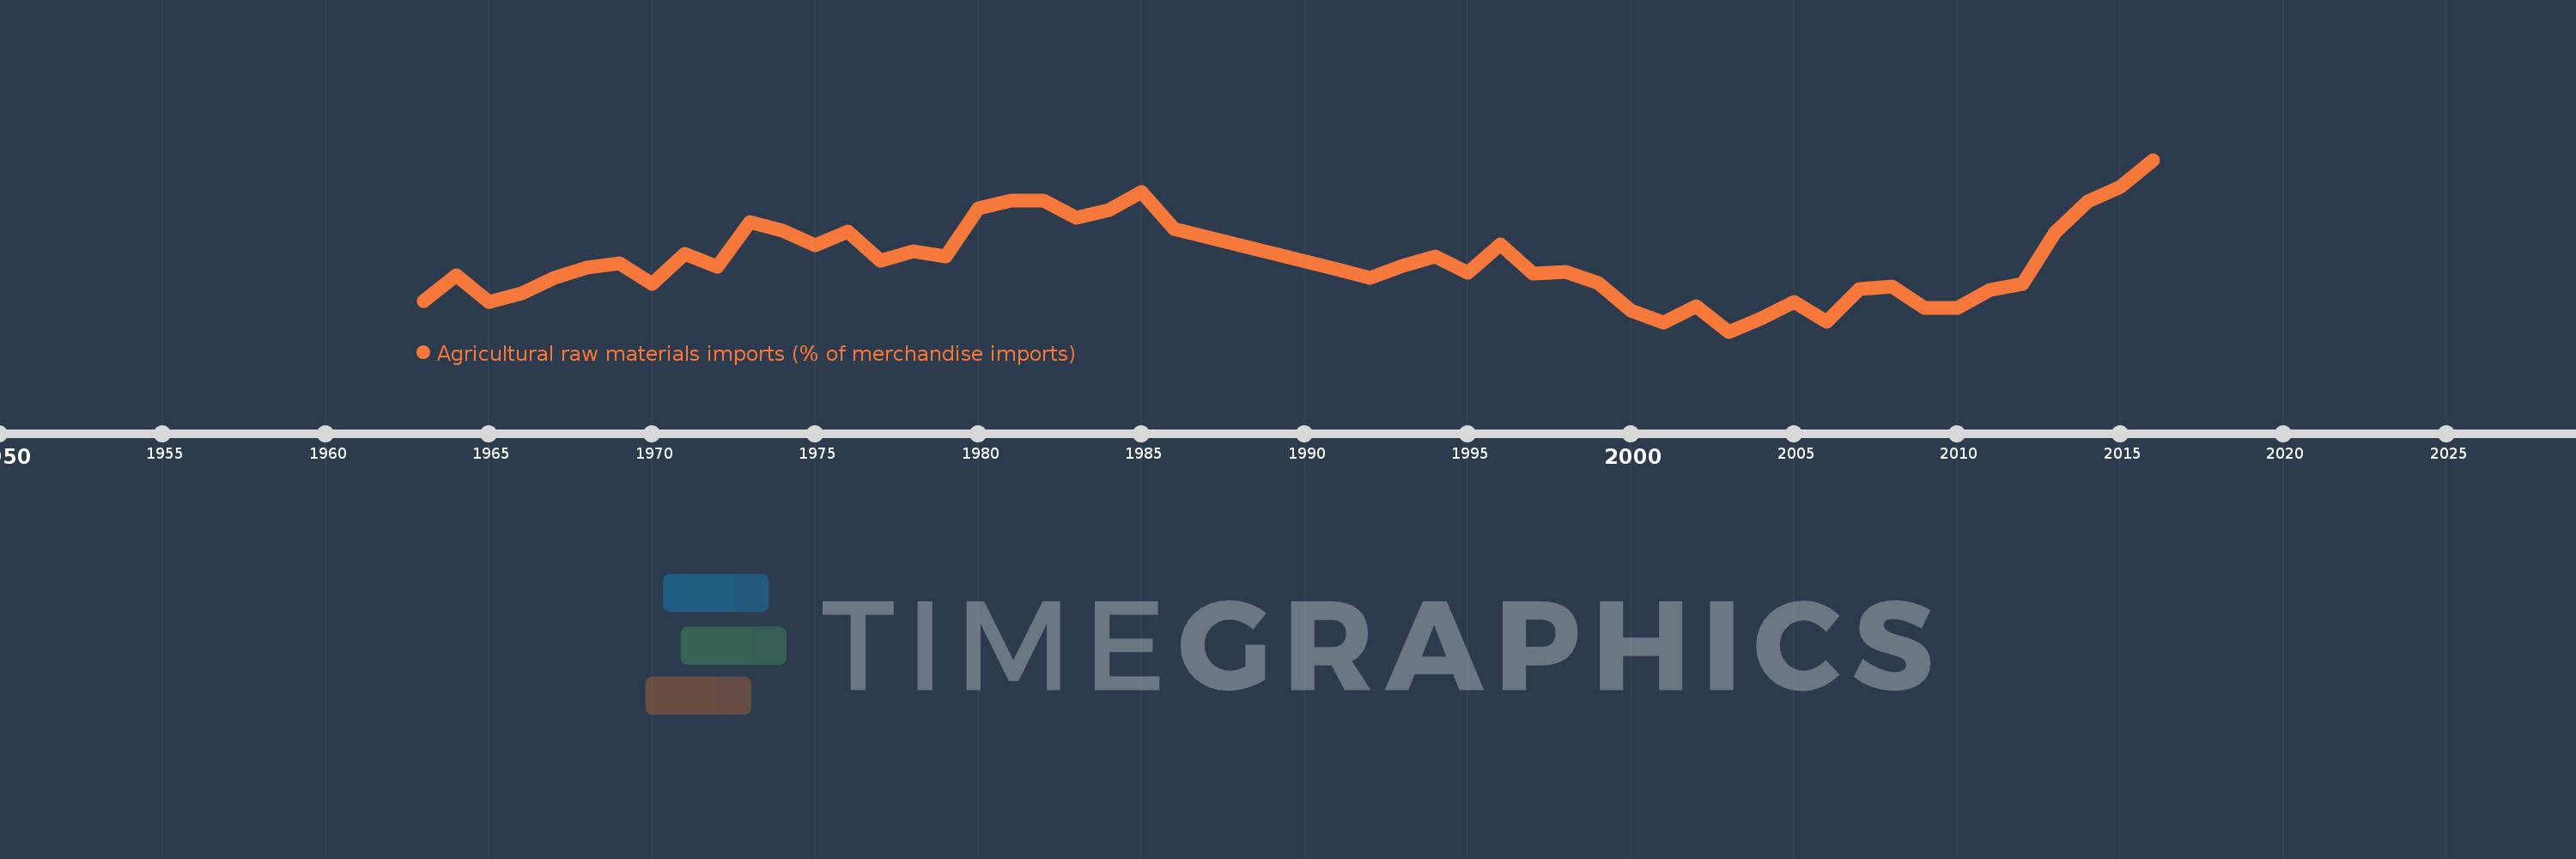
Agricultural raw materials imports (% of merchandise imports)
2016,2015,2014,2013,2012,2011,2010,2009,2008,2007,2006,2005,2004,2003,2002,2001,2000,1999,1998,1997,1996,1995,1994,1993,1992,1991,1986,1985,1984,1983,1982,1981,1980,1979,1978,1977,1976,1975,1974,1973,1972,1971,1970,1969,1968,1967,1966,1965,1964,1963
This statistics in other country:
AfghanistanAlbaniaAlgeriaAndorraAngolaAntigua and BarbudaArab WorldArgentinaArmeniaArubaAustraliaAustriaAzerbaijanBahamas, TheBahrainBangladeshBarbadosBelarusBelgiumBelizeBeninBermudaBhutanBoliviaBosnia and HerzegovinaBotswanaBrazilBrunei DarussalamBulgariaBurkina FasoBurundiCabo VerdeCambodiaCameroonCanadaCaribbean small statesCayman IslandsCentral African RepublicCentral Europe and the BalticsChadChileChinaColombiaComorosCongo, Dem. Rep.Congo, Rep.Costa RicaCote d'IvoireCroatiaCubaCyprusCzech RepublicDenmarkDjiboutiDominicaDominican RepublicEarly-demographic dividendEast Asia & PacificEast Asia & Pacific (excluding high income)East Asia & Pacific (IDA & IBRD countries)EcuadorEgypt, Arab Rep.El SalvadorEquatorial GuineaEritreaEstoniaEthiopiaEuro areaEurope & Central AsiaEurope & Central Asia (excluding high income)Europe & Central Asia (IDA & IBRD countries)European UnionFaroe IslandsFijiFinlandFragile and conflict affected situationsFranceFrench PolynesiaGabonGambia, TheGeorgiaGermanyGhanaGreeceGreenlandGrenadaGuatemalaGuineaGuinea-BissauGuyanaHaitiHeavily indebted poor countries (HIPC)High incomeHondurasHong Kong SAR, ChinaHungaryIBRD onlyIcelandIDA & IBRD totalIDA blendIDA onlyIDA totalIndiaIndonesiaIran, Islamic Rep.IraqIrelandIsraelItalyJamaicaJapanJordanKazakhstanKenyaKiribatiKorea, Rep.KuwaitKyrgyz RepublicLao PDRLate-demographic dividendLatin America & Caribbean Latin America & Caribbean (excluding high income)Latin America & the Caribbean (IDA & IBRD countries)LatviaLeast developed countries: UN classificationLebanonLesothoLiberiaLibyaLithuaniaLow & middle incomeLow incomeLower middle incomeLuxembourgMacao SAR, ChinaMacedonia, FYRMadagascarMalawiMalaysiaMaldivesMaliMaltaMauritaniaMauritiusMexicoMiddle East & North AfricaMiddle East & North Africa (excluding high income)Middle East & North Africa (IDA & IBRD countries)Middle incomeMoldovaMongoliaMoroccoMozambiqueMyanmarNamibiaNepalNetherlandsNew CaledoniaNew ZealandNicaraguaNigerNigeriaNorth AmericaNorwayOECD membersOmanOther small statesPacific island small statesPakistanPalauPanamaPapua New GuineaParaguayPeruPhilippinesPolandPortugalPost-demographic dividendPre-demographic dividendQatarRomaniaRussian FederationRwandaSamoaSao Tome and PrincipeSaudi ArabiaSenegalSerbiaSeychellesSierra LeoneSingaporeSlovak RepublicSloveniaSmall statesSolomon IslandsSomaliaSouth AfricaSouth AsiaSouth Asia (IDA & IBRD)SpainSri LankaSt. Kitts and NevisSt. LuciaSt. Vincent and the GrenadinesSub-Saharan Africa Sub-Saharan Africa (excluding high income)Sub-Saharan Africa (IDA & IBRD countries)SudanSurinameSwazilandSwedenSwitzerlandSyrian Arab RepublicTajikistanTanzaniaThailandTimor-LesteTogoTongaTrinidad and TobagoTunisiaTurkeyTurkmenistanTurks and Caicos IslandsTuvaluUgandaUkraineUnited Arab EmiratesUnited KingdomUnited StatesUpper middle incomeUruguayVanuatuVenezuela, RBVietnamVirgin Islands (U.S.)WorldYemen, Rep.ZambiaZimbabwe Timeline:
This timeline shows a graph from 1963 to 2016 of Madagascar. No data until 1962. Number of actual observations by date: 50.
Source name:
World Development Indicators
Source organization:
World Bank staff estimates from the Comtrade database maintained by the United Nations Statistics Division.
Categories, topics:
Agriculture & Rural Development, Private Sector, Trade
Last updated:
apr 23, 2017
Indicators value changes by year
At the date of observation
Value
Absolute change
Change from previous value
jan 1, 1963
0.75
+0.75
0.0%
jan 1, 1964
1.251
+0.501
66.76%
jan 1, 1965
0.739
-0.512
-40.95%
jan 1, 1966
0.9
+0.161
21.75%
jan 1, 1967
1.193
+0.294
32.66%
jan 1, 1968
1.402
+0.209
17.48%
jan 1, 1969
1.474
+0.072
5.15%
jan 1, 1970
1.086
-0.388
-26.33%
jan 1, 1971
1.666
+0.58
53.4%
jan 1, 1972
1.409
-0.257
-15.42%
jan 1, 1973
2.263
+0.854
60.6%
jan 1, 1974
2.104
-0.159
-7.02%
jan 1, 1975
1.824
-0.28
-13.32%
jan 1, 1976
2.086
+0.263
14.39%
jan 1, 1977
1.527
-0.559
-26.78%
jan 1, 1978
1.704
+0.176
11.55%
jan 1, 1979
1.612
-0.092
-5.41%
jan 1, 1980
2.524
+0.912
56.58%
jan 1, 1981
2.673
+0.149
5.91%
jan 1, 1982
2.674
+0.001
0.06%
jan 1, 1983
2.348
-0.326
-12.2%
jan 1, 1984
2.506
+0.158
6.71%
jan 1, 1985
2.846
+0.34
13.57%
jan 1, 1986
2.141
-0.705
-24.77%
jan 1, 1991
1.363
-0.778
-36.34%
jan 1, 1992
1.197
-0.166
-12.19%
jan 1, 1993
1.422
+0.226
18.85%
jan 1, 1994
1.617
+0.195
13.7%
jan 1, 1995
1.299
-0.318
-19.65%
jan 1, 1996
1.841
+0.542
41.72%
jan 1, 1997
1.276
-0.566
-30.73%
jan 1, 1998
1.321
+0.045
3.54%
jan 1, 1999
1.106
-0.215
-16.27%
jan 1, 2000
0.58
-0.526
-47.59%
jan 1, 2001
0.341
-0.239
-41.22%
jan 1, 2002
0.652
+0.311
91.3%
jan 1, 2003
0.171
-0.481
-73.81%
jan 1, 2004
0.424
+0.254
148.61%
jan 1, 2005
0.739
+0.315
74.15%
jan 1, 2006
0.364
-0.374
-50.68%
jan 1, 2007
0.986
+0.622
170.57%
jan 1, 2008
1.032
+0.046
4.62%
jan 1, 2009
0.623
-0.409
-39.64%
jan 1, 2010
0.619
-0.003
-0.5%
jan 1, 2011
0.964
+0.345
55.69%
jan 1, 2012
1.09
+0.126
13.02%
jan 1, 2013
2.077
+0.987
90.57%
jan 1, 2014
2.659
+0.582
28.02%
jan 1, 2015
2.951
+0.292
10.96%
jan 1, 2016
3.461
+0.51
17.29%
Ranking of countries by current statistics by years


Comments: