29
/
en
AIzaSyAYiBZKx7MnpbEhh9jyipgxe19OcubqV5w
April 1, 2024
250479
St. Lucia
LCA
true
2
1
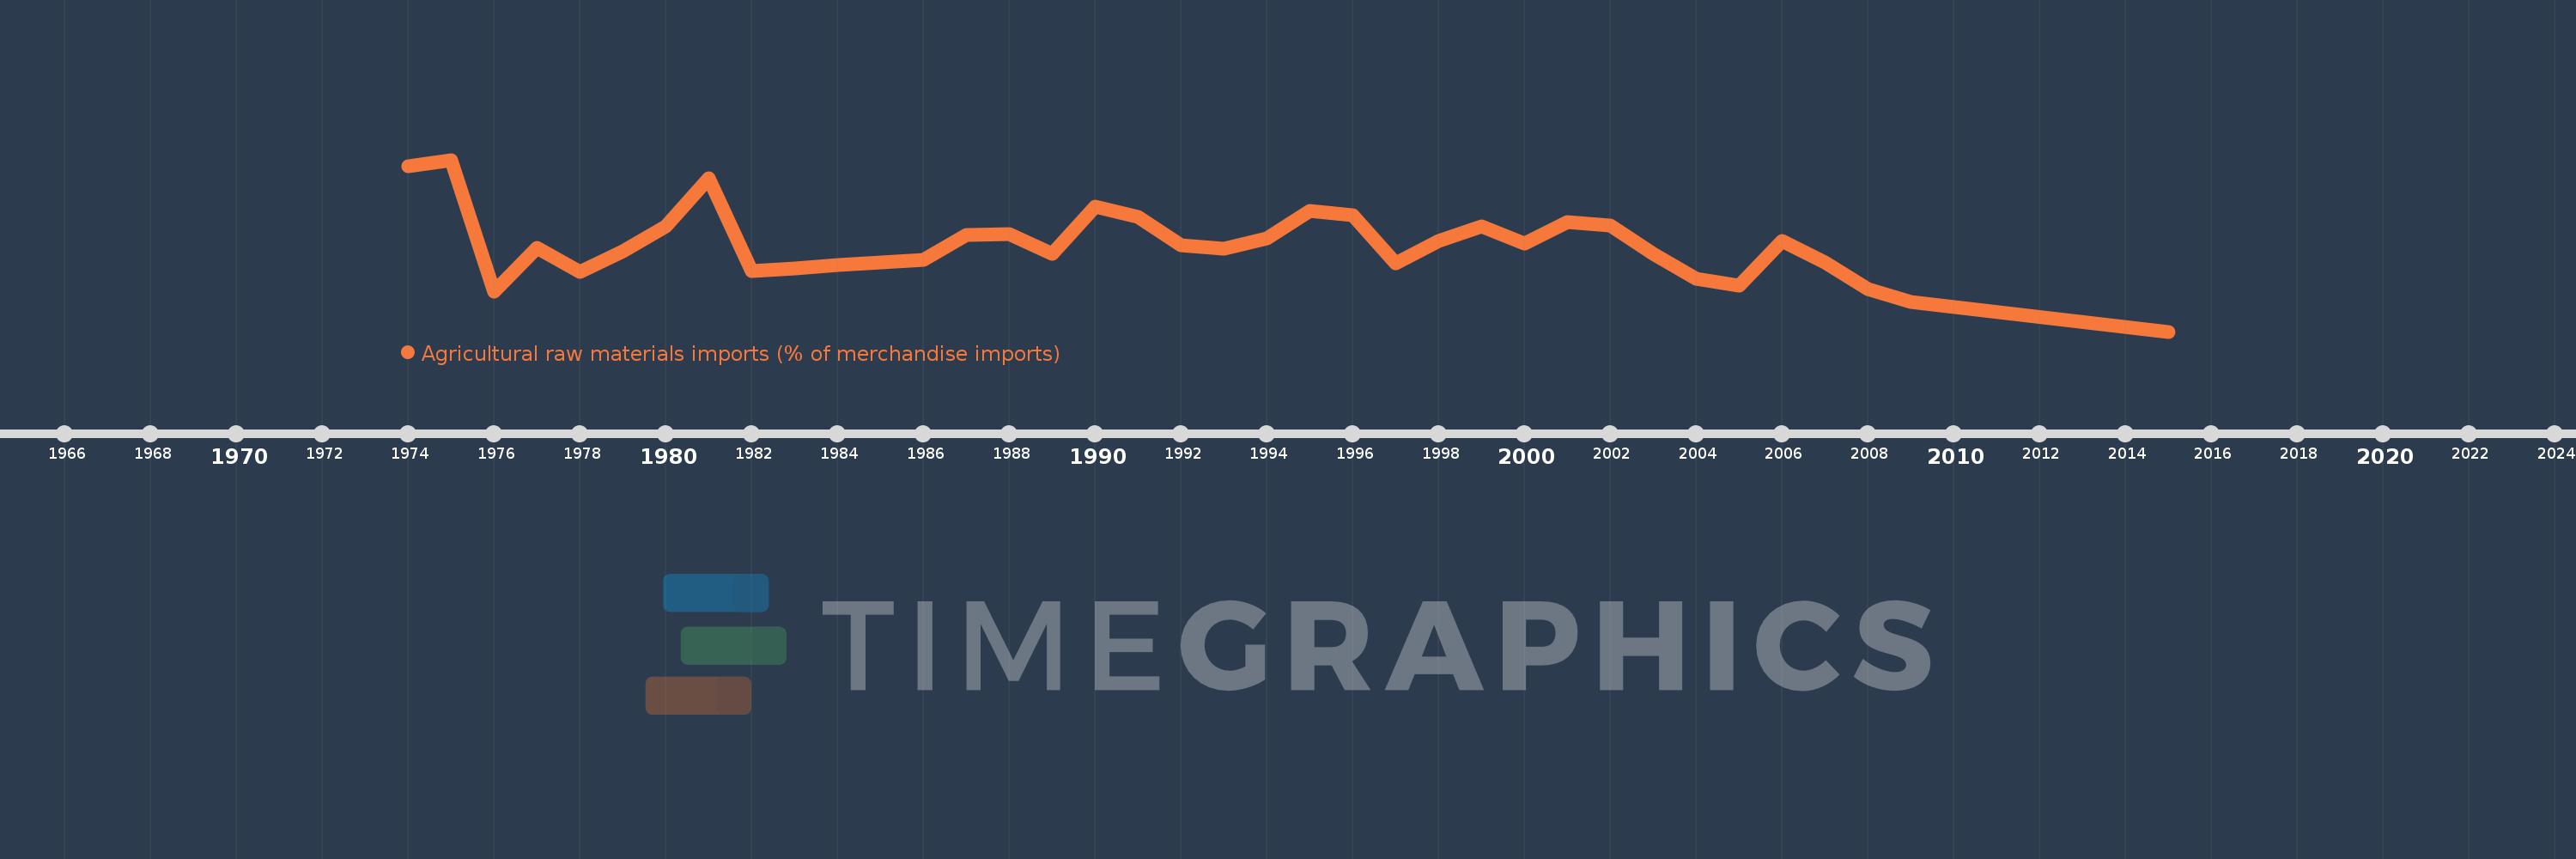
Agricultural raw materials imports (% of merchandise imports)
2015,2009,2008,2007,2006,2005,2004,2003,2002,2001,2000,1999,1998,1997,1996,1995,1994,1993,1992,1991,1990,1989,1988,1987,1986,1984,1983,1982,1981,1980,1979,1978,1977,1976,1975,1974
This statistics in other country:
AfghanistanAlbaniaAlgeriaAndorraAngolaAntigua and BarbudaArab WorldArgentinaArmeniaArubaAustraliaAustriaAzerbaijanBahamas, TheBahrainBangladeshBarbadosBelarusBelgiumBelizeBeninBermudaBhutanBoliviaBosnia and HerzegovinaBotswanaBrazilBrunei DarussalamBulgariaBurkina FasoBurundiCabo VerdeCambodiaCameroonCanadaCaribbean small statesCayman IslandsCentral African RepublicCentral Europe and the BalticsChadChileChinaColombiaComorosCongo, Dem. Rep.Congo, Rep.Costa RicaCote d'IvoireCroatiaCubaCyprusCzech RepublicDenmarkDjiboutiDominicaDominican RepublicEarly-demographic dividendEast Asia & PacificEast Asia & Pacific (excluding high income)East Asia & Pacific (IDA & IBRD countries)EcuadorEgypt, Arab Rep.El SalvadorEquatorial GuineaEritreaEstoniaEthiopiaEuro areaEurope & Central AsiaEurope & Central Asia (excluding high income)Europe & Central Asia (IDA & IBRD countries)European UnionFaroe IslandsFijiFinlandFragile and conflict affected situationsFranceFrench PolynesiaGabonGambia, TheGeorgiaGermanyGhanaGreeceGreenlandGrenadaGuatemalaGuineaGuinea-BissauGuyanaHaitiHeavily indebted poor countries (HIPC)High incomeHondurasHong Kong SAR, ChinaHungaryIBRD onlyIcelandIDA & IBRD totalIDA blendIDA onlyIDA totalIndiaIndonesiaIran, Islamic Rep.IraqIrelandIsraelItalyJamaicaJapanJordanKazakhstanKenyaKiribatiKorea, Rep.KuwaitKyrgyz RepublicLao PDRLate-demographic dividendLatin America & Caribbean Latin America & Caribbean (excluding high income)Latin America & the Caribbean (IDA & IBRD countries)LatviaLeast developed countries: UN classificationLebanonLesothoLiberiaLibyaLithuaniaLow & middle incomeLow incomeLower middle incomeLuxembourgMacao SAR, ChinaMacedonia, FYRMadagascarMalawiMalaysiaMaldivesMaliMaltaMauritaniaMauritiusMexicoMiddle East & North AfricaMiddle East & North Africa (excluding high income)Middle East & North Africa (IDA & IBRD countries)Middle incomeMoldovaMongoliaMoroccoMozambiqueMyanmarNamibiaNepalNetherlandsNew CaledoniaNew ZealandNicaraguaNigerNigeriaNorth AmericaNorwayOECD membersOmanOther small statesPacific island small statesPakistanPalauPanamaPapua New GuineaParaguayPeruPhilippinesPolandPortugalPost-demographic dividendPre-demographic dividendQatarRomaniaRussian FederationRwandaSamoaSao Tome and PrincipeSaudi ArabiaSenegalSerbiaSeychellesSierra LeoneSingaporeSlovak RepublicSloveniaSmall statesSolomon IslandsSomaliaSouth AfricaSouth AsiaSouth Asia (IDA & IBRD)SpainSri LankaSt. Kitts and NevisSt. LuciaSt. Vincent and the GrenadinesSub-Saharan Africa Sub-Saharan Africa (excluding high income)Sub-Saharan Africa (IDA & IBRD countries)SudanSurinameSwazilandSwedenSwitzerlandSyrian Arab RepublicTajikistanTanzaniaThailandTimor-LesteTogoTongaTrinidad and TobagoTunisiaTurkeyTurkmenistanTurks and Caicos IslandsTuvaluUgandaUkraineUnited Arab EmiratesUnited KingdomUnited StatesUpper middle incomeUruguayVanuatuVenezuela, RBVietnamVirgin Islands (U.S.)WorldYemen, Rep.ZambiaZimbabwe Timeline:
This timeline shows a graph from 1974 to 2015 of St. Lucia. No data until 1973. Number of actual observations by date: 36.
Source name:
World Development Indicators
Source organization:
World Bank staff estimates from the Comtrade database maintained by the United Nations Statistics Division.
Categories, topics:
Agriculture & Rural Development, Private Sector, Trade
Last updated:
apr 23, 2017
Indicators value changes by year
At the date of observation
Value
Absolute change
Change from previous value
jan 1, 1974
2.975
+2.975
0.0%
jan 1, 1975
3.044
+0.07
2.35%
jan 1, 1976
1.571
-1.473
-48.39%
jan 1, 1977
2.059
+0.488
31.04%
jan 1, 1978
1.787
-0.272
-13.19%
jan 1, 1979
2.019
+0.232
12.96%
jan 1, 1980
2.302
+0.283
14.03%
jan 1, 1981
2.833
+0.531
23.06%
jan 1, 1982
1.796
-1.037
-36.61%
jan 1, 1983
1.825
+0.029
1.6%
jan 1, 1984
1.862
+0.038
2.06%
jan 1, 1986
1.929
+0.067
3.6%
jan 1, 1987
2.201
+0.272
14.08%
jan 1, 1988
2.213
+0.012
0.53%
jan 1, 1989
1.99
-0.223
-10.07%
jan 1, 1990
2.522
+0.533
26.77%
jan 1, 1991
2.407
-0.115
-4.56%
jan 1, 1992
2.084
-0.324
-13.44%
jan 1, 1993
2.046
-0.038
-1.81%
jan 1, 1994
2.161
+0.115
5.62%
jan 1, 1995
2.475
+0.314
14.51%
jan 1, 1996
2.428
-0.046
-1.87%
jan 1, 1997
1.883
-0.546
-22.46%
jan 1, 1998
2.136
+0.253
13.42%
jan 1, 1999
2.301
+0.165
7.73%
jan 1, 2000
2.104
-0.197
-8.57%
jan 1, 2001
2.351
+0.247
11.76%
jan 1, 2002
2.308
-0.043
-1.84%
jan 1, 2003
1.987
-0.321
-13.91%
jan 1, 2004
1.716
-0.271
-13.62%
jan 1, 2005
1.637
-0.079
-4.63%
jan 1, 2006
2.14
+0.504
30.79%
jan 1, 2007
1.9
-0.24
-11.22%
jan 1, 2008
1.6
-0.3
-15.78%
jan 1, 2009
1.456
-0.144
-9.0%
jan 1, 2015
1.122
-0.335
-22.97%
Ranking of countries by current statistics by years


Comments: