29
/
en
AIzaSyAYiBZKx7MnpbEhh9jyipgxe19OcubqV5w
April 1, 2024
41218
Latin America & Caribbean
LCN
false
2
1
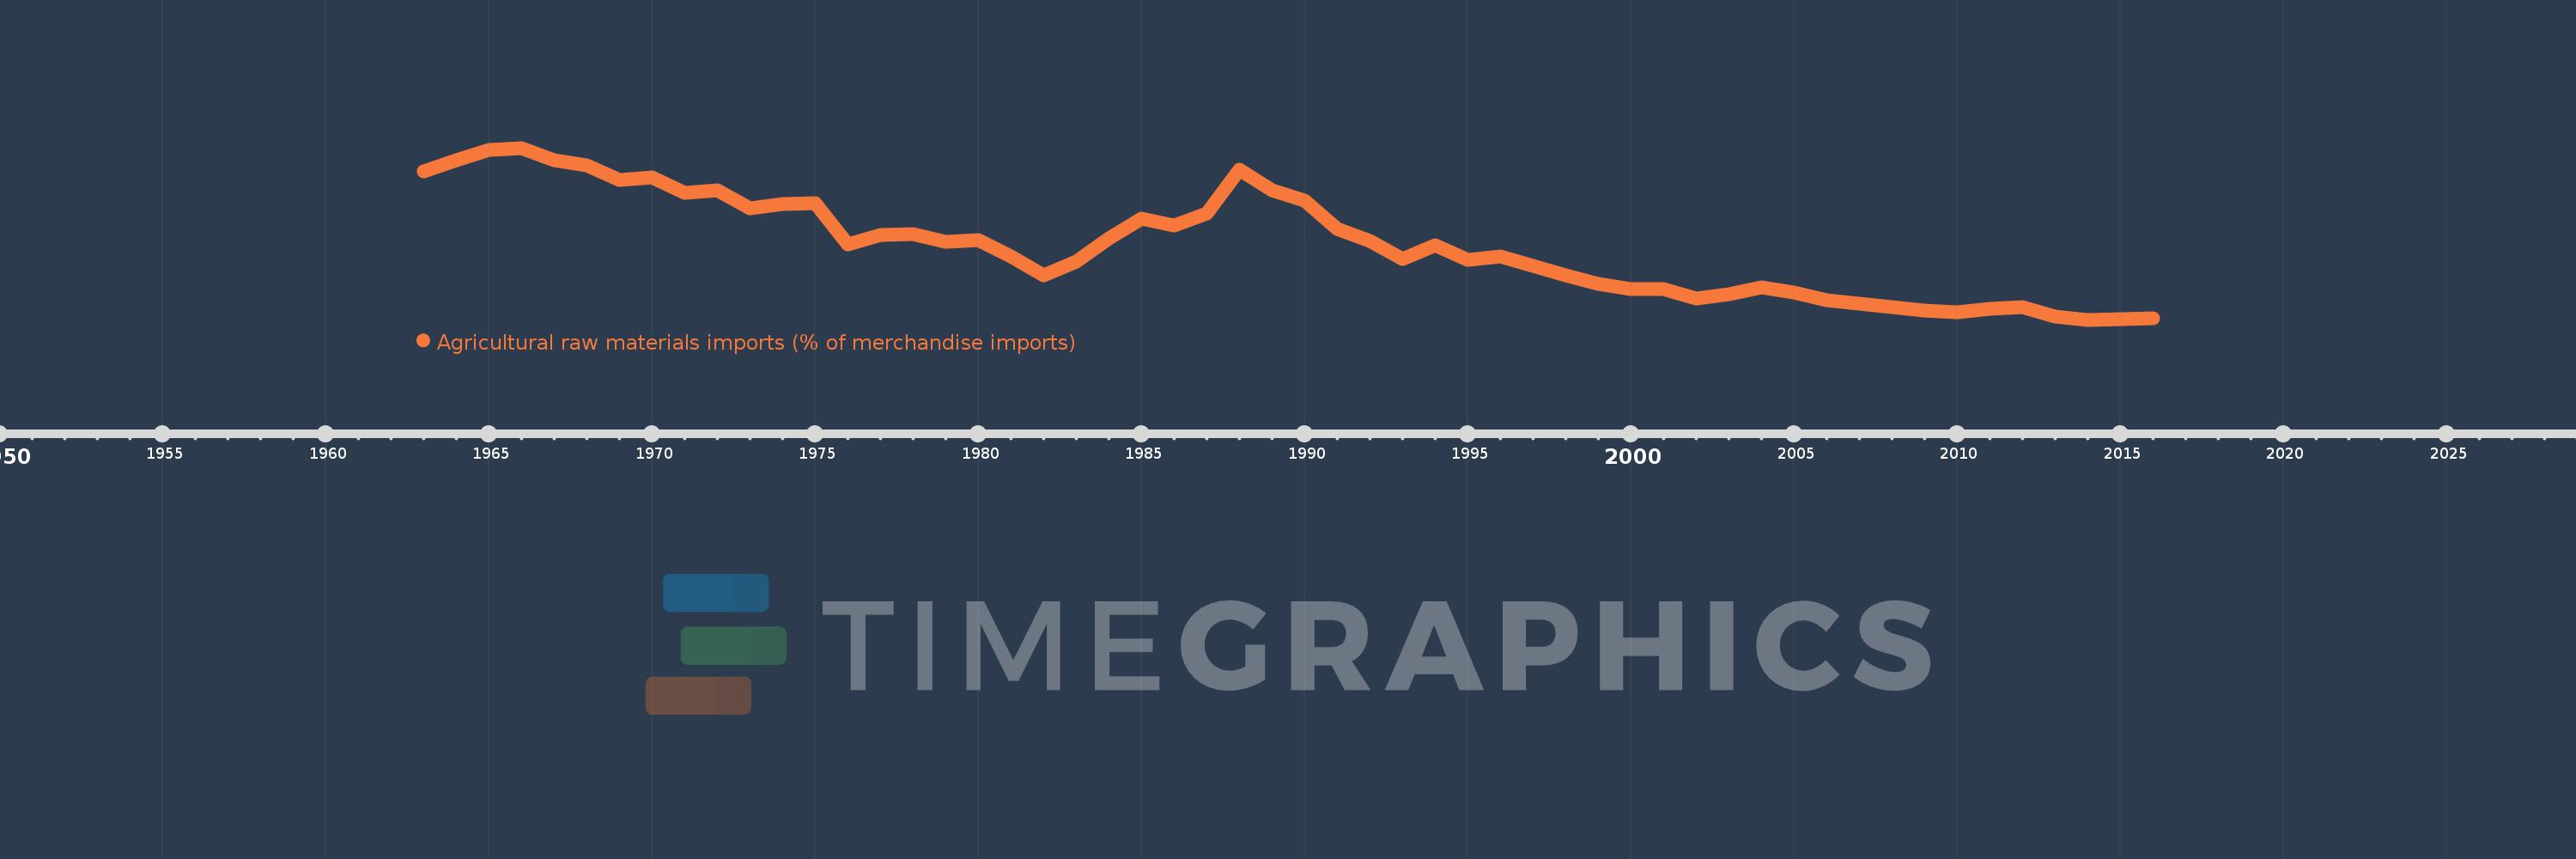
Agricultural raw materials imports (% of merchandise imports)
2016,2015,2014,2013,2012,2011,2010,2009,2008,2007,2006,2005,2004,2003,2002,2001,2000,1999,1998,1997,1996,1995,1994,1993,1992,1991,1990,1989,1988,1987,1986,1985,1984,1983,1982,1981,1980,1979,1978,1977,1976,1975,1974,1973,1972,1971,1970,1969,1968,1967,1966,1965,1964,1963
This statistics in other country:
AfghanistanAlbaniaAlgeriaAndorraAngolaAntigua and BarbudaArab WorldArgentinaArmeniaArubaAustraliaAustriaAzerbaijanBahamas, TheBahrainBangladeshBarbadosBelarusBelgiumBelizeBeninBermudaBhutanBoliviaBosnia and HerzegovinaBotswanaBrazilBrunei DarussalamBulgariaBurkina FasoBurundiCabo VerdeCambodiaCameroonCanadaCaribbean small statesCayman IslandsCentral African RepublicCentral Europe and the BalticsChadChileChinaColombiaComorosCongo, Dem. Rep.Congo, Rep.Costa RicaCote d'IvoireCroatiaCubaCyprusCzech RepublicDenmarkDjiboutiDominicaDominican RepublicEarly-demographic dividendEast Asia & PacificEast Asia & Pacific (excluding high income)East Asia & Pacific (IDA & IBRD countries)EcuadorEgypt, Arab Rep.El SalvadorEquatorial GuineaEritreaEstoniaEthiopiaEuro areaEurope & Central AsiaEurope & Central Asia (excluding high income)Europe & Central Asia (IDA & IBRD countries)European UnionFaroe IslandsFijiFinlandFragile and conflict affected situationsFranceFrench PolynesiaGabonGambia, TheGeorgiaGermanyGhanaGreeceGreenlandGrenadaGuatemalaGuineaGuinea-BissauGuyanaHaitiHeavily indebted poor countries (HIPC)High incomeHondurasHong Kong SAR, ChinaHungaryIBRD onlyIcelandIDA & IBRD totalIDA blendIDA onlyIDA totalIndiaIndonesiaIran, Islamic Rep.IraqIrelandIsraelItalyJamaicaJapanJordanKazakhstanKenyaKiribatiKorea, Rep.KuwaitKyrgyz RepublicLao PDRLate-demographic dividendLatin America & Caribbean Latin America & Caribbean (excluding high income)Latin America & the Caribbean (IDA & IBRD countries)LatviaLeast developed countries: UN classificationLebanonLesothoLiberiaLibyaLithuaniaLow & middle incomeLow incomeLower middle incomeLuxembourgMacao SAR, ChinaMacedonia, FYRMadagascarMalawiMalaysiaMaldivesMaliMaltaMauritaniaMauritiusMexicoMiddle East & North AfricaMiddle East & North Africa (excluding high income)Middle East & North Africa (IDA & IBRD countries)Middle incomeMoldovaMongoliaMoroccoMozambiqueMyanmarNamibiaNepalNetherlandsNew CaledoniaNew ZealandNicaraguaNigerNigeriaNorth AmericaNorwayOECD membersOmanOther small statesPacific island small statesPakistanPalauPanamaPapua New GuineaParaguayPeruPhilippinesPolandPortugalPost-demographic dividendPre-demographic dividendQatarRomaniaRussian FederationRwandaSamoaSao Tome and PrincipeSaudi ArabiaSenegalSerbiaSeychellesSierra LeoneSingaporeSlovak RepublicSloveniaSmall statesSolomon IslandsSomaliaSouth AfricaSouth AsiaSouth Asia (IDA & IBRD)SpainSri LankaSt. Kitts and NevisSt. LuciaSt. Vincent and the GrenadinesSub-Saharan Africa Sub-Saharan Africa (excluding high income)Sub-Saharan Africa (IDA & IBRD countries)SudanSurinameSwazilandSwedenSwitzerlandSyrian Arab RepublicTajikistanTanzaniaThailandTimor-LesteTogoTongaTrinidad and TobagoTunisiaTurkeyTurkmenistanTurks and Caicos IslandsTuvaluUgandaUkraineUnited Arab EmiratesUnited KingdomUnited StatesUpper middle incomeUruguayVanuatuVenezuela, RBVietnamVirgin Islands (U.S.)WorldYemen, Rep.ZambiaZimbabwe Timeline:
This timeline shows a graph from 1963 to 2016 of Latin America & Caribbean . No data until 1962. Number of actual observations by date: 54.
Source name:
World Development Indicators
Source organization:
World Bank staff estimates from the Comtrade database maintained by the United Nations Statistics Division.
Categories, topics:
Agriculture & Rural Development, Private Sector, Trade
Last updated:
apr 23, 2017
Indicators value changes by year
At the date of observation
Value
Absolute change
Change from previous value
jan 1, 1963
4.179
+4.179
0.0%
jan 1, 1964
4.415
+0.237
5.66%
jan 1, 1965
4.64
+0.224
5.08%
jan 1, 1966
4.678
+0.039
0.84%
jan 1, 1967
4.416
-0.262
-5.6%
jan 1, 1968
4.294
-0.122
-2.77%
jan 1, 1969
3.993
-0.301
-7.0%
jan 1, 1970
4.034
+0.041
1.02%
jan 1, 1971
3.707
-0.327
-8.11%
jan 1, 1972
3.763
+0.056
1.51%
jan 1, 1973
3.382
-0.381
-10.14%
jan 1, 1974
3.477
+0.096
2.83%
jan 1, 1975
3.494
+0.017
0.49%
jan 1, 1976
2.608
-0.887
-25.37%
jan 1, 1977
2.801
+0.193
7.42%
jan 1, 1978
2.823
+0.022
0.79%
jan 1, 1979
2.658
-0.166
-5.87%
jan 1, 1980
2.686
+0.028
1.06%
jan 1, 1981
2.337
-0.349
-13.0%
jan 1, 1982
1.931
-0.405
-17.34%
jan 1, 1983
2.234
+0.303
15.67%
jan 1, 1984
2.729
+0.494
22.13%
jan 1, 1985
3.154
+0.426
15.6%
jan 1, 1986
2.998
-0.156
-4.94%
jan 1, 1987
3.26
+0.261
8.72%
jan 1, 1988
4.206
+0.946
29.02%
jan 1, 1989
3.763
-0.443
-10.53%
jan 1, 1990
3.543
-0.22
-5.84%
jan 1, 1991
2.93
-0.613
-17.31%
jan 1, 1992
2.675
-0.255
-8.7%
jan 1, 1993
2.277
-0.398
-14.89%
jan 1, 1994
2.575
+0.298
13.08%
jan 1, 1995
2.27
-0.304
-11.82%
jan 1, 1996
2.341
+0.071
3.12%
jan 1, 1997
2.131
-0.21
-8.96%
jan 1, 1998
1.924
-0.208
-9.75%
jan 1, 1999
1.75
-0.174
-9.02%
jan 1, 2000
1.641
-0.109
-6.21%
jan 1, 2001
1.645
+0.003
0.2%
jan 1, 2002
1.438
-0.206
-12.55%
jan 1, 2003
1.527
+0.089
6.19%
jan 1, 2004
1.664
+0.137
8.97%
jan 1, 2005
1.565
-0.099
-5.96%
jan 1, 2006
1.395
-0.17
-10.88%
jan 1, 2007
1.324
-0.071
-5.07%
jan 1, 2008
1.242
-0.082
-6.22%
jan 1, 2009
1.167
-0.075
-6.05%
jan 1, 2010
1.127
-0.04
-3.4%
jan 1, 2011
1.218
+0.091
8.11%
jan 1, 2012
1.252
+0.033
2.74%
jan 1, 2013
1.042
-0.21
-16.78%
jan 1, 2014
0.975
-0.067
-6.43%
jan 1, 2015
0.983
+0.009
0.91%
jan 1, 2016
0.998
+0.014
1.45%
Ranking of countries by current statistics by years


Comments: